
How to Choose a Social Media Ads Agency: 525 Case Studies
13 min readLast updated October 9, 2026
On this page
- The short answer
- 1. Know what a realistic result looks like
- 2. Separate reach from results
- 3. Look for results in the metric your business runs on
- 4. Ask which platforms the agency runs
- 5. Ask how ROAS was measured and what was spent
- 6. Check that social ads is a core service
- 7. Ask whether the client confirmed it
- Questions to ask a social media ads agency
- Red flags when hiring a social media ads agency
- Related guides
- Find a social media ads agency
- About the data
- FAQs
Most guides to choosing a social media ads agency tell you to check which platforms it covers, look at its creative and read its case studies. They rarely say what a social ads case study should contain, or how to tell a result from a large number.
This guide does. Each step below comes from 525 social media ads case studies published by 40 agencies and indexed in OpenServed's directory. We counted what agencies report, what they leave out, and what a typical published result looks like, so every piece of advice here comes with evidence.
Data as of October 2026. The full numbers are in Social Media Ads Statistics 2026.
The short answer
- Know what a realistic result looks like. The median published case study reports a 106% increase in revenue and a 45% cut in cost per acquisition.
- Separate reach from results. 18% of case studies show reach or engagement with no business or cost result.
- Look for results in the metric your business runs on. Online stores should see revenue and ROAS; lead-driven businesses should see leads and cost per lead.
- Ask which platforms the agency runs. Only 22% of case studies name a platform.
- Ask how ROAS was measured and what was spent. Of the 91 case studies that report ROAS, 9 mention the spend.
- Check that social ads is a core service. Only 9 of the 40 agencies have social ads in at least half of their case studies.
- Ask whether the client confirmed it. Only 4% of social media ads case studies are Client-verified.
1. Know what a realistic result looks like
The typical published result is close to a doubling. The median reported increase is 106% for revenue (109 case studies) and 97% for conversions or leads (110 case studies). Half of the revenue gains fall between 47% and 291%.
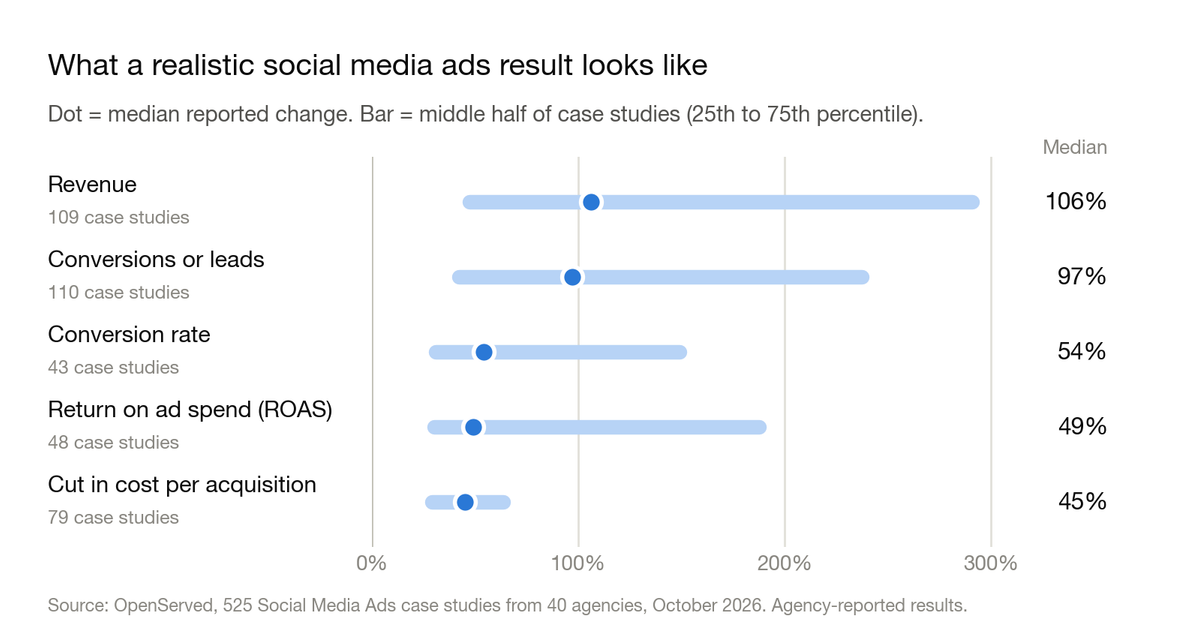
The median cut in cost per acquisition or lead is 45%. Among the 79 case studies that state a reduction, half fall between 29% and 64%.
ROAS gains are smaller than revenue gains. The median reported increase in return on ad spend is 49% (48 case studies). Where agencies quote the ROAS itself, the median is 8.0x, and half fall between 3.0x and 13.7x.
These are the wins. Agencies publish the campaigns that went well, so a typical account is likely to land lower.
Online stores report revenue gains a little below the overall median. The median is 98% for retail and ecommerce clients (50 case studies) and 80% for fashion, beauty and jewelry (30 case studies).
Four-digit percentages are rare. Only 45 case studies (8.6%) contain a claim of 1,000% or more.
What to do: ask an agency what result it expects for you and what that estimate is based on. A range near these figures, tied to accounts like yours, is a good sign. Be wary of a guarantee, or of a promised result far above a doubling with no explanation.
2. Separate reach from results
A third of social media ads case studies report reach. 34% include a stat about views, impressions, followers or engagement. 57% include a business result: revenue, leads or conversions.
Nearly one in five shows reach and nothing else that matters. 18% of the case studies include a reach or engagement stat with no revenue, leads, conversions, cost or return figure.
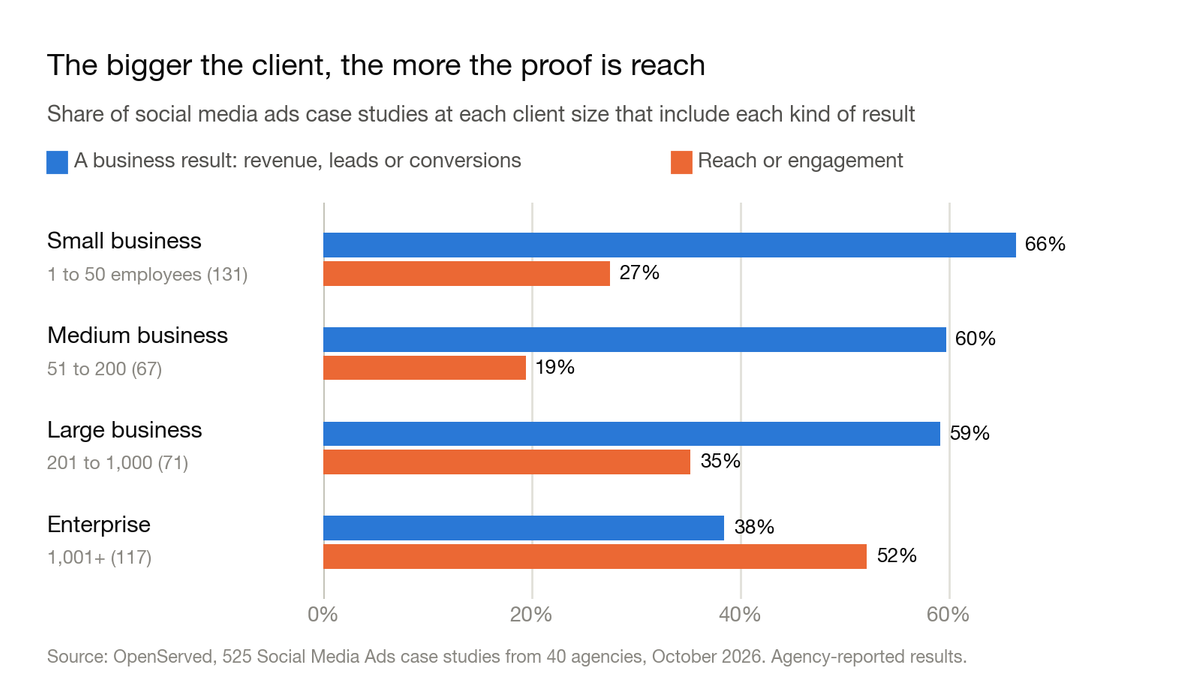
The bigger the client, the more the proof is reach. For small businesses, 66% of case studies report a business result and 27% report reach. For enterprises it flips: 38% report a business result and 52% report reach. More than a third of enterprise case studies (37%) show reach with no business or cost figure.
Most reach numbers are raw counts. Of the 181 case studies with a reach or engagement stat, 106 give only totals, such as a number of video views, with no change against a starting point. Only 29 of the 181 say anything about cost.
Reach is more common in some industries. A reach or engagement stat appears in 60% of media and entertainment case studies, 48% of food and beverage ones and 45% of home, property and local services ones. In software and technology it is 21%.
Awareness is a fair goal, but it has its own measures. Only 26 case studies (5%) report a brand lift, ad recall or awareness result.
What to do: if your goal is sales or leads, ask what the reach led to. If your goal is awareness, ask what each thousand impressions or each view cost, and whether brand lift was measured. A view count on its own answers neither.
3. Look for results in the metric your business runs on
Social ads are proven in different numbers depending on what you sell. A revenue stat appears in 61% of retail and ecommerce case studies and 48% of fashion, beauty and jewelry ones. ROAS appears in 30% and 35% of them.
Lead-driven businesses are shown leads and cost. A leads stat appears in 54% of education and nonprofit case studies, 28% of financial services ones and 26% of healthcare ones. A cost per acquisition or lead stat appears in 41% of healthcare case studies and 37% of software ones. ROAS appears in fewer than 10% of case studies in any of these industries.
Only about a quarter show growth and cost together. 27% of the case studies report a growth result (revenue, leads or conversions) alongside a cost or return figure (cost per acquisition, ROAS or ROI). Another 30% show growth with no cost or return figure.
What to do: if you sell online, look for agencies whose case studies report revenue and ROAS. If you generate leads, look for lead volume and cost per lead. Either way, ask for the growth number and the cost number from the same campaign.
4. Ask which platforms the agency runs
Most case studies don't say which platform the ads ran on. Only 113 of the 525 case studies (22%) name a platform in their results. The rest don't say.
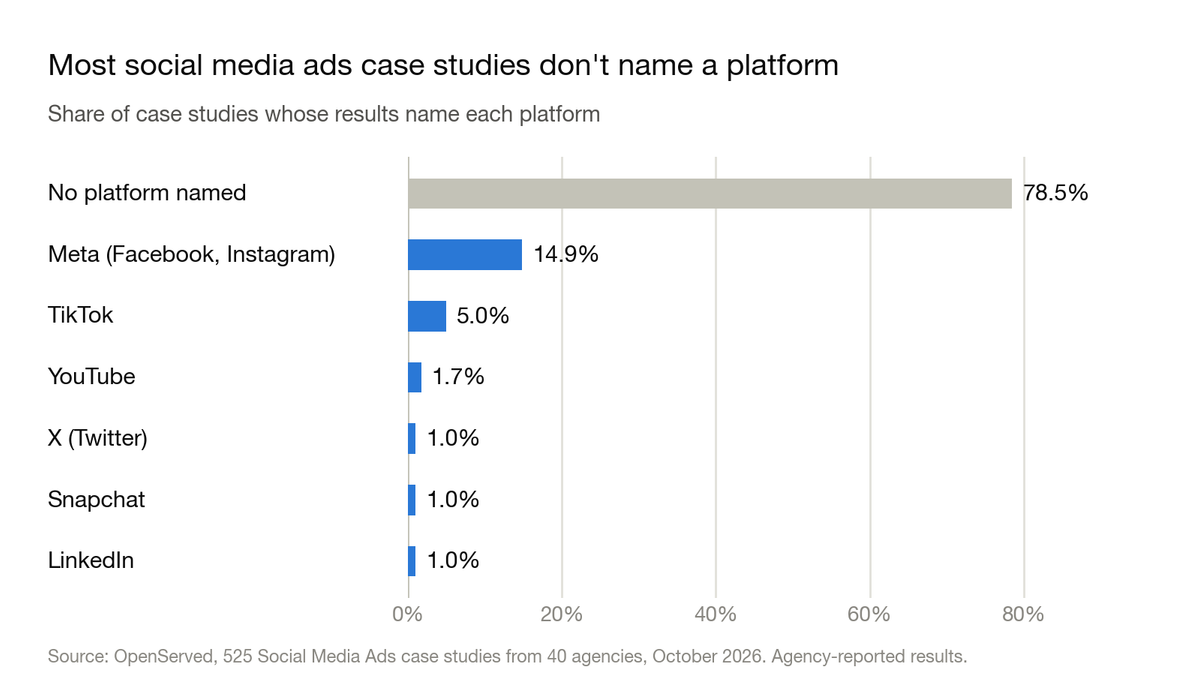
Where a platform is named, it is usually Meta. Facebook or Instagram is named in 78 case studies, which is 69% of those that name a platform. TikTok is named in 26 and YouTube in 9.
Published proof on LinkedIn is thin. LinkedIn is named in five case studies. If you sell to other businesses and expect to advertise there, don't assume an agency's results carry over from Meta.
Few case studies cover more than one platform. Only 19 (3.6%) name two or more.
Case studies that name a platform lean on reach. A reach or engagement stat appears in 55% of the Meta case studies and 69% of the TikTok ones, against 34% of all social media ads case studies. The TikTok figure rests on 26 case studies.
What to do: ask which platforms the agency would run for you and why, and ask for results on each one for a business like yours. Our data can't judge creative, because case study stats rarely describe the ads themselves. Ask to see ads the agency made for a similar business on the platform you plan to use.
5. Ask how ROAS was measured and what was spent
ROAS is quoted often and explained rarely. 91 case studies (17%) report a return on ad spend. Only 9 of those 91 mention the spend behind it.
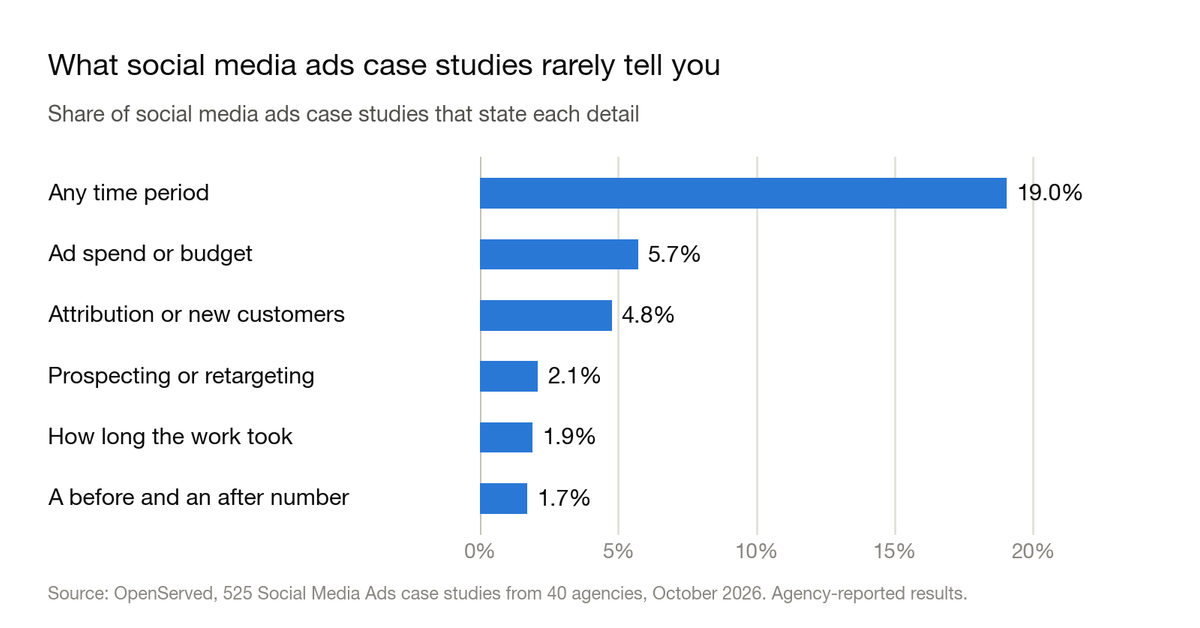
Spend is almost never disclosed. 5.7% of social media ads case studies mention ad spend or budget, and 12 give a dollar amount.
Almost none say how results were counted. Under 5% say anything about attribution or about new customers. On social platforms that matters: the same campaign can show a very different ROAS depending on the attribution window and on whether sales after a view, not a click, are counted.
Almost none say who saw the ads. 2.1% say whether a result came from prospecting or retargeting. Retargeting reaches people who already know the brand, so its ROAS is usually higher and says less about finding new customers.
The starting point and the timeframe are missing too. 1.9% of case studies state how long the work took, and 1.7% give a before and an after number. 19% mention any time period at all.
What to do: for any ROAS an agency shows you, ask what was spent, which attribution window was used, how much of the revenue came from new customers, and over how many months. An agency that ran the account can answer all four.
6. Check that social ads is a core service
For most agencies, social ads is one service among several. 40 of the 75 agencies in our directory have published a social media ads case study. Only 9 of the 40 have social ads in at least half of their case studies.
Many have only a handful. 18 of the 40 agencies have five or fewer social media ads case studies. Nine have 20 or more. Three agencies (Hawke Media, LYFE Marketing and KlientBoost) account for 33% of the total.
Three quarters of the case studies bundle other services. 75% list at least one more service. 39% also list PPC, and 10% list influencer marketing. 24% include a result from another channel, such as search or email.
Bundled work reports larger gains in conversions or leads. The median is 106% where social ads is bundled (87 case studies), against 67% where it is the only service (23). Revenue goes the other way: 128% for social-only case studies (21), against 101% for bundled ones (88).
What to do: count how many social media ads case studies an agency has, and how many report social results on their own. If it has a handful, or its social results always arrive mixed with search ads and email, ask who runs paid social there and what they have run recently.
7. Ask whether the client confirmed it
Only 4% of social media ads case studies are Client-verified. That is 21 of 525, from 8 agencies. On OpenServed, Client-verified means the client has confirmed the results. Everything else is as reported by the agency.
There are too few to compare. With 21 verified case studies, we can't say whether verified results run higher or lower than the rest.
What to do: ask whether you can speak with the client behind a case study. A reference call is a reasonable thing to ask for before you sign.
Questions to ask a social media ads agency
Each question below comes from one of the seven steps. A good answer is specific; a warning sign is a number with nothing behind it.
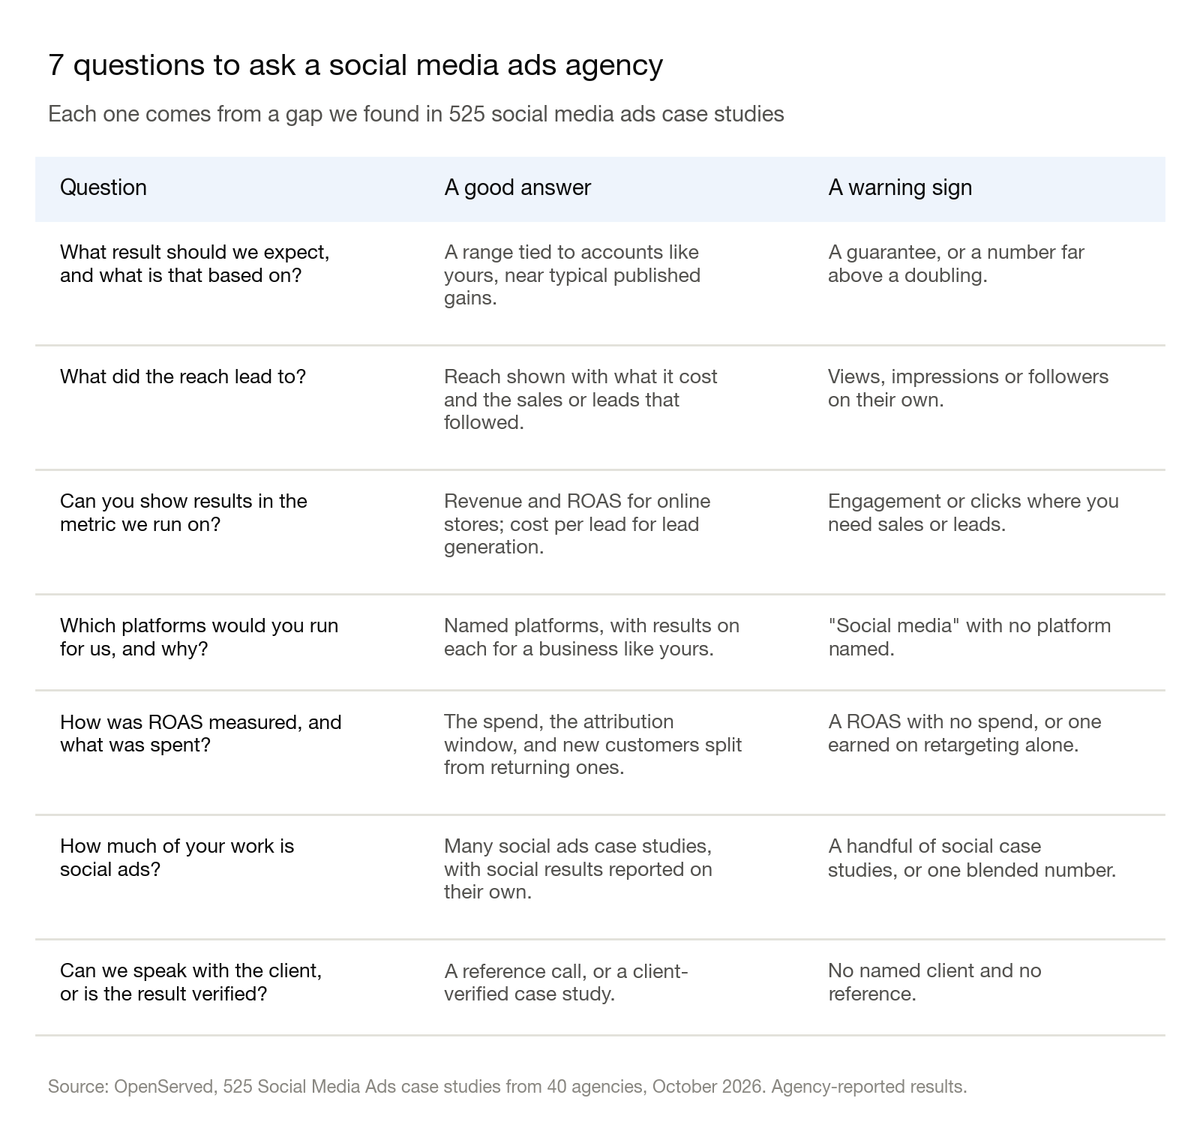
- What result should we expect, and what is that based on? A good answer is a range tied to accounts like yours, near typical published gains. A warning sign is a guarantee, or a number far above a doubling.
- What did the reach lead to? A good answer shows reach with what it cost and the sales or leads that followed. A warning sign is views, impressions or followers on their own.
- Can you show results in the metric we run on? A good answer is revenue and ROAS for online stores, or cost per lead for lead generation. A warning sign is engagement or clicks where you need sales or leads.
- Which platforms would you run for us, and why? A good answer names the platforms, with results on each for a business like yours. A warning sign is "social media" with no platform named.
- How was ROAS measured, and what was spent? A good answer gives the spend, the attribution window, and new customers split from returning ones. A warning sign is a ROAS with no spend, or one earned on retargeting alone.
- How much of your work is social ads? A good answer is many social ads case studies, with social results reported on their own. A warning sign is a handful of social case studies, or one blended number.
- Can we speak with the client, or is the result verified? A good answer is a reference call or a client-verified case study. A warning sign is no named client and no reference.
Red flags when hiring a social media ads agency
- A guaranteed result. Published revenue gains have a median of 106% and a very wide spread. Nobody can promise where your account will land.
- Reach with nothing after it. 18% of case studies show views, impressions or engagement with no business or cost figure. A large view count is not a result.
- ROAS with no spend. Of the 91 case studies that report ROAS, 9 mention the spend behind it. A high ROAS on a small budget, or on retargeting alone, says little.
- Growth with no cost. 30% of case studies show more revenue, leads or conversions with no cost or return figure.
- No platform named. 78% of case studies don't say where the ads ran. An agency should be able to tell you which platform produced which result.
- Results measured against a benchmark. About 7% of case studies include a result stated against a goal or a platform benchmark, not against where the account started.
- Social ads as a side service. 18 of the 40 agencies have five or fewer social media ads case studies.
One more thing to settle before you sign: get the agency's fee in writing, separate from your ad spend. Our data has no pricing, so we can't tell you what a fair fee is, but you should know exactly what you are paying the agency and what you are paying the platforms.
Related guides
- How to choose a digital marketing agency, the general guide across every service.
- How to choose a PPC agency, if search ads are part of the plan.
- How to choose an SEO agency.
Find a social media ads agency
OpenServed's social media ads agency directory lists agencies by the case studies they have published, so you can check each of the steps above before you make contact. You can narrow it to your industry, such as ecommerce, fashion or healthcare, or to your size, such as small business or enterprise. Look for the Client-verified badge on results the client has confirmed.
About the data
The figures in this guide come from the 525 case studies in OpenServed's directory that list Social Media Ads as a service, published by 40 agencies, as of October 2026. Results are as reported by each agency; only 21 have been confirmed by the client. Agencies publish their best work, so these numbers describe successful campaigns, not average ones. Platform figures count only case studies whose results name the platform. The full method is in Social Media Ads Statistics 2026.
FAQs
How do I choose a social media ads agency?
Check seven things: whether its promised result is realistic, whether it shows results or only reach, whether it reports the metric your business runs on, which platforms it runs, how ROAS was measured and what was spent, how much of its work is social ads, and whether clients have confirmed it.
What results should I expect from a social media ads agency?
The median published case study reports a 106% increase in revenue, a 97% increase in conversions or leads and a 45% cut in cost per acquisition. These are agencies' best results, so a typical account is likely to land lower.
What is a good ROAS for social media ads?
Where agencies quote a ROAS, the median is 8.0x, and half fall between 3.0x and 13.7x. Only 41 case studies give one, and agencies quote ROAS when it looks good, so read it as a best case. Always ask what spend it was earned on and how it was attributed.
Are views, impressions and followers good results?
Only if awareness is your goal, and then you should also see what the reach cost. 18% of social media ads case studies show reach or engagement with no business or cost figure. If you need sales or leads, ask what the reach led to.
Which social media platform should I advertise on?
Our data can't pick one for you. Only 22% of case studies name a platform, and most of those name Meta (Facebook or Instagram). Ask each agency which platform it would run for a business like yours, and for results on that platform.
How long do social media ads take to work?
Our data can't say: fewer than 2% of social media ads case studies state how long the work took. Ask the agency to put expected milestones and a timeline in writing.
How much does a social media ads agency cost?
Our data has no pricing, so we don't quote figures. Ask each agency for its fee in writing, separate from your ad spend, and compare like with like.