
Social Media Ads Statistics 2026: Results From 500+ Agency Case Studies
15 min readLast updated October 9, 2026
On this page
- Social media ads statistics at a glance
- What social media ads case studies report
- Social media ads cost per acquisition statistics
- Social media ads revenue and ROAS statistics
- Social media ads conversion and lead statistics
- Social media engagement and reach statistics
- Social media ads statistics by platform
- Social media ads statistics by industry
- Social media ads statistics by client size
- Social media ads statistics by country
- How long social media ads take: what the data can't tell you
- How social media ads are sold: bundles and agencies
- How much of this data is verified?
- What this means if you're hiring a social media ads agency
- Methodology
- FAQs
Most social media advertising statistics describe the platforms: how many users each one has, what an average click costs. They don't tell you what happens when an agency runs the campaigns.
This page does. Every number below is counted from 525 social media ads case studies published by 40 marketing agencies, all indexed in OpenServed's directory. Each case study names a client and states the results the agency reported: acquisition cost, ROAS, revenue, leads, engagement and reach.
Data as of October 2026. These are results agencies chose to publish, so they show what a successful campaign looks like, not what an average one does. The directory keeps growing, so if you cite a number, please cite the date.
Social media ads statistics at a glance
- 525 social media ads case studies from 40 agencies, covering 99 industries and clients in 23 countries and territories.
- 45% is the median reported cut in cost per acquisition or lead. Half of the 79 case studies that state one fall between 29% and 64%.
- 106% is the median reported increase in revenue, across 109 case studies.
- 97% is the median reported increase in conversions or leads, across 110 case studies.
- 49% is the median reported increase in ROAS, across 48 case studies. Where agencies state the ROAS itself, the median is 8.0x.
- 132% is the median reported gain in engagement and reach, across 52 case studies.
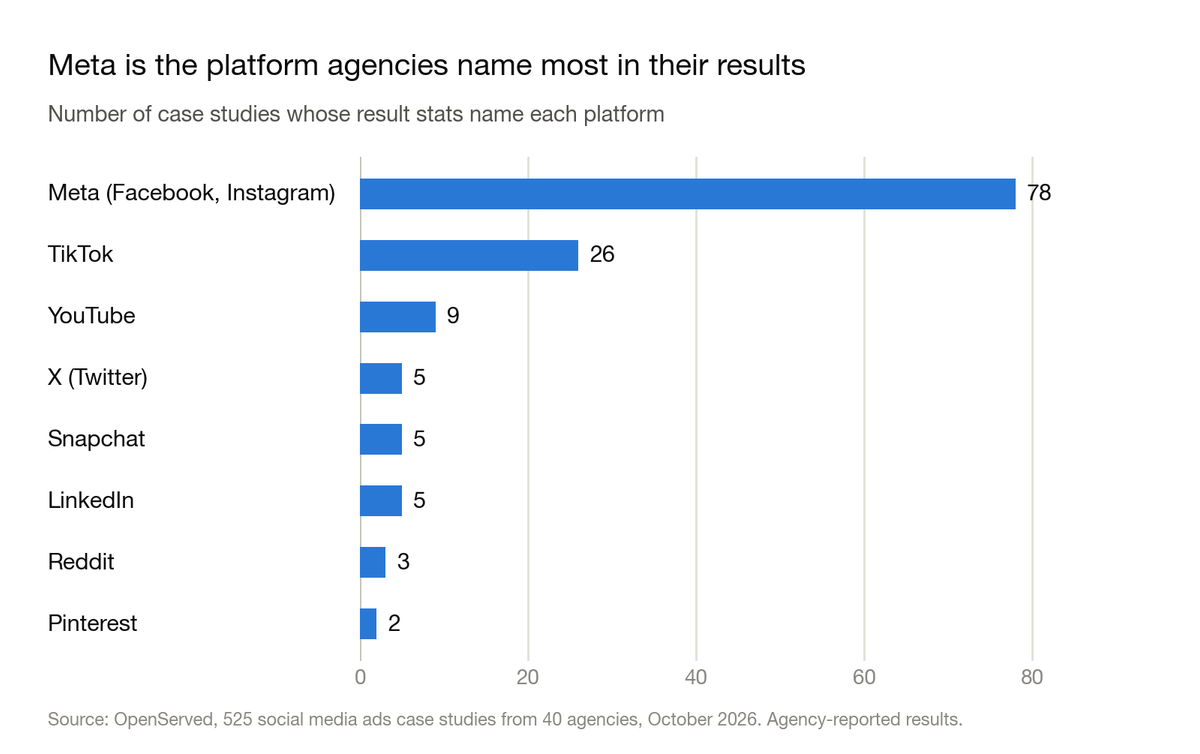
- Meta is named in the results of 78 case studies and TikTok in 26. No other platform is named in more than 9.
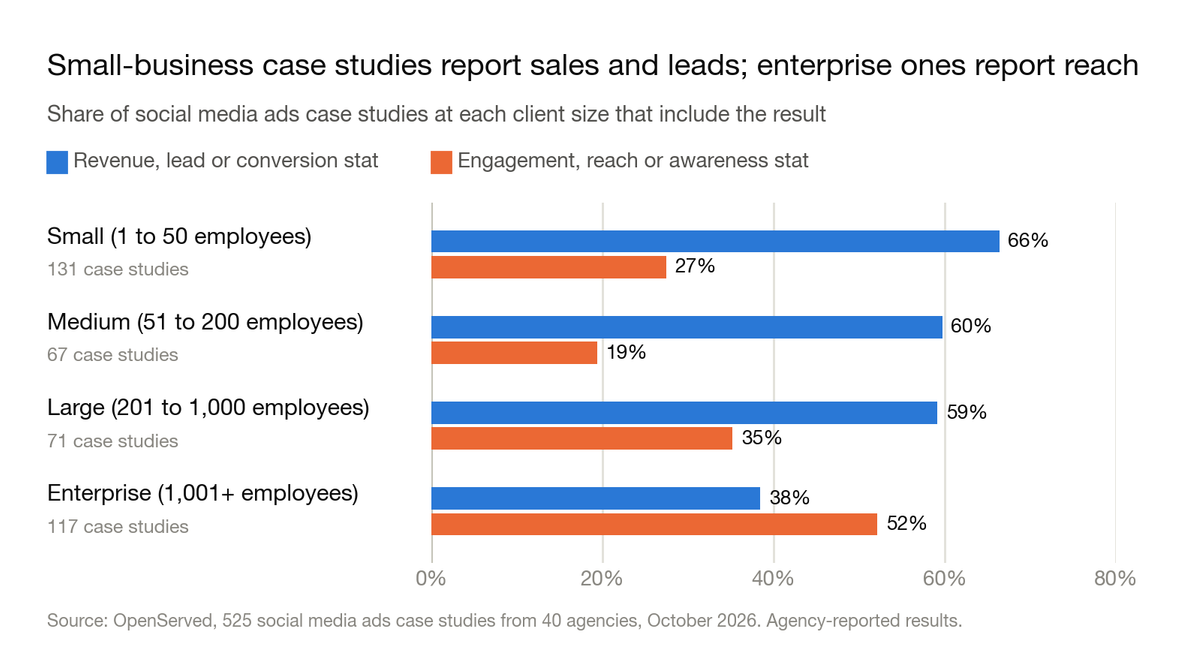
- Enterprise case studies report reach more often than sales. 52% include an engagement or awareness stat, against 27% of small-business ones.
- Only 25% of these case studies are about social media ads alone. PPC appears alongside in 39%.
- Only 4% are Client-verified, and fewer than 2% say how long the work took.
What social media ads case studies report
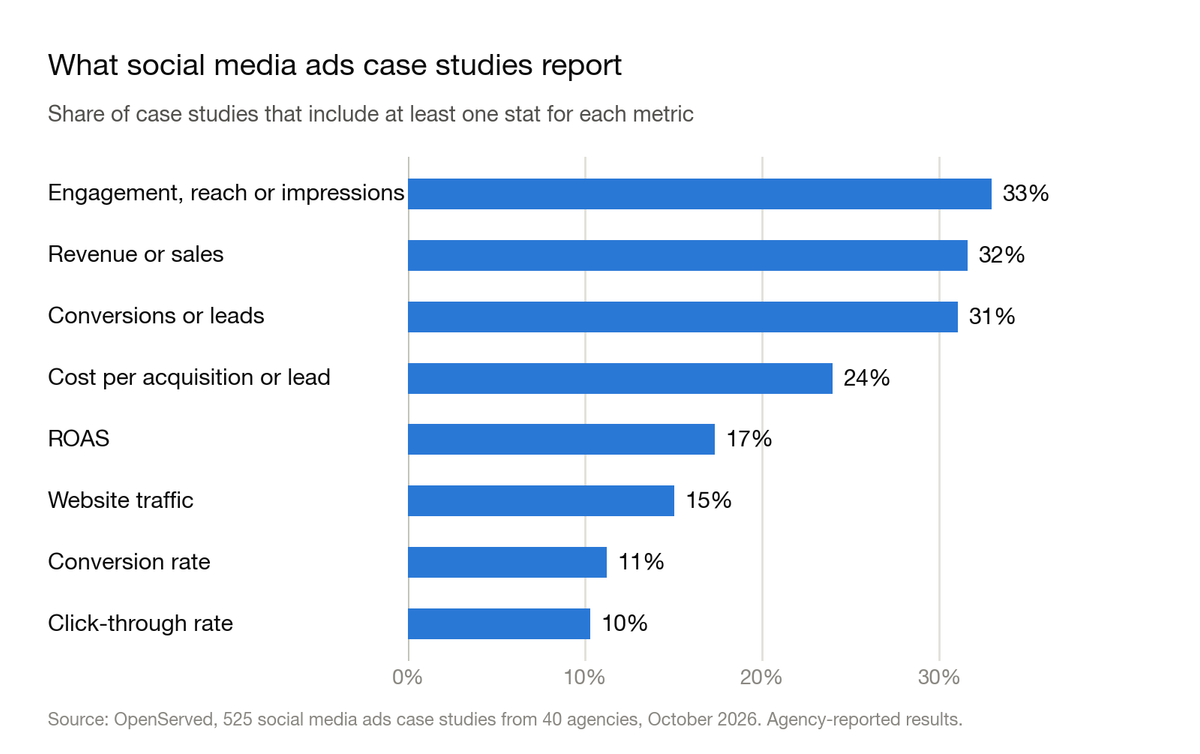
Reach, revenue and leads are reported about equally often. 33% of social media ads case studies include an engagement, reach or impressions stat, 32% a revenue or sales stat, and 31% a conversion or lead stat. Cost per acquisition or lead appears in 24%, ROAS in 17%, website traffic in 15%, conversion rate in 11% and click-through rate in 10%.
57% report a business outcome. That means revenue, leads or conversions. The other 43% stop at engagement, reach, clicks or traffic.
42% report an efficiency metric, such as cost per acquisition, cost per click, ROAS or ROI.
62% of result stats are percentages. The 525 case studies carry 1,745 result stats, an average of 3.3 each. Another 7% lead with a dollar figure and 4% use a multiplier such as "5x". The medians below use only stats that state a percentage change.
Social media ads cost per acquisition statistics
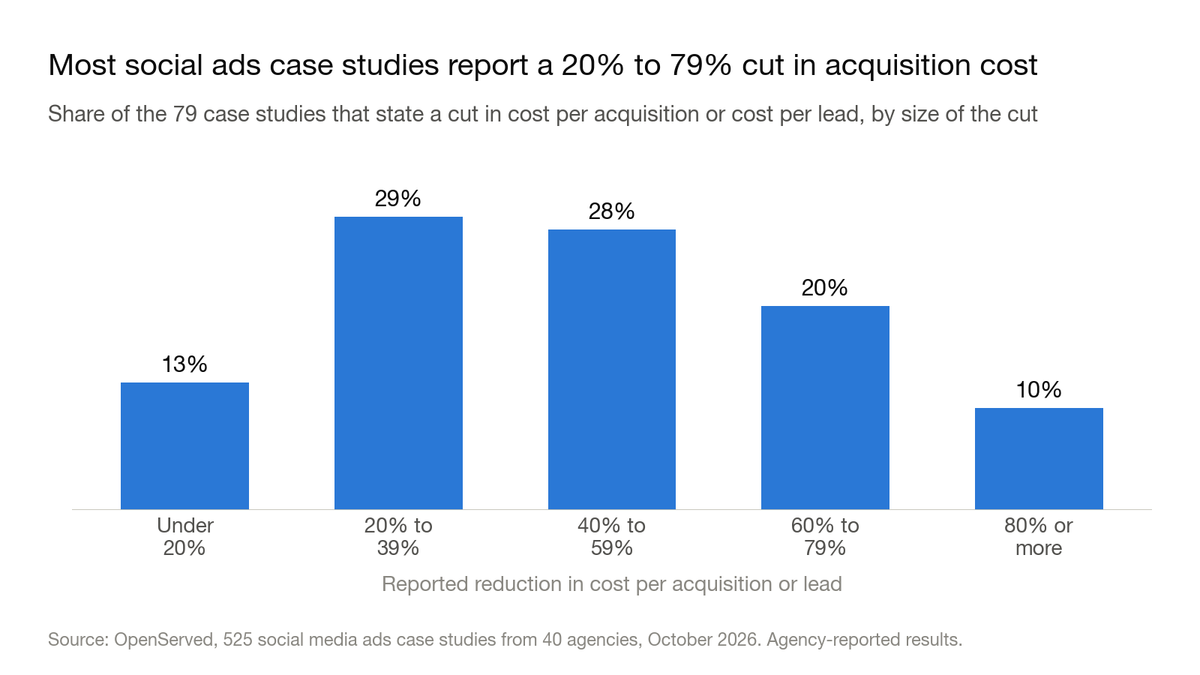
The median social media ads case study reports a 45% cut in cost per acquisition or lead. 79 case studies state a percentage reduction. A quarter report 29% or less, and a quarter report 64% or more.
More than half report a cut of 40% or more. The full spread:
- Under 20%: 13% of case studies
- 20% to 39%: 29%
- 40% to 59%: 28%
- 60% to 79%: 20%
- 80% or more: 10%
That is a larger cut than PPC case studies report. The median for PPC is 39%. See PPC Statistics 2026.
Cost per click is rarely reported. Only 11 case studies state a percentage cut in cost per click or cost per thousand impressions, too few for a benchmark.
Social media ads revenue and ROAS statistics
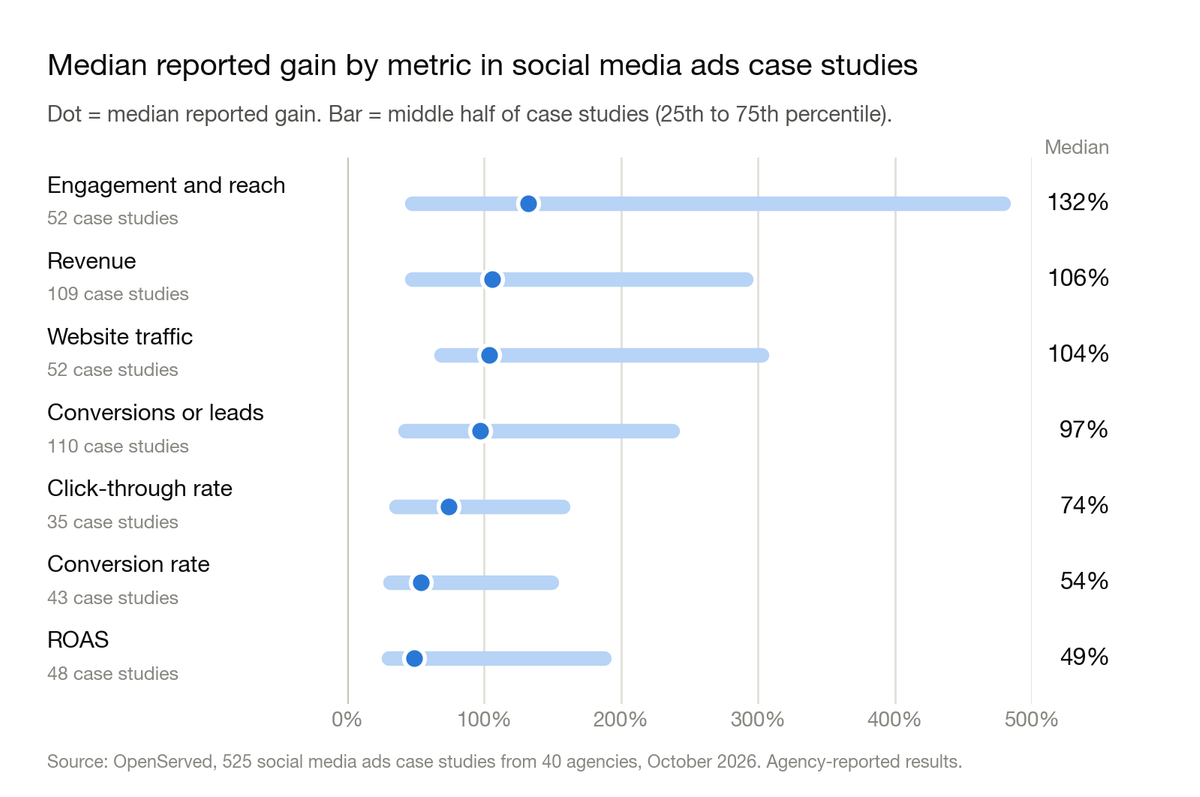
The median reported increase in revenue is 106%. 109 case studies state a percentage gain in revenue, sales, transactions or orders. The middle half runs from 47% to 291%, and 53% report at least a doubling.
The median reported increase in ROAS is 49%. 48 case studies state a percentage gain in return on ad spend, with the middle half between 30% and 188%.
Where agencies state the ROAS itself, the median is 8.0x. 41 case studies give a ROAS figure instead of a change. The middle half runs from 3.0x to 13.7x, and 78% are 3x or higher. Agencies quote a ROAS figure when it looks good, so treat 8.0x as a published best case, not a typical account.
ROAS is reported more often for social ads than for PPC. It appears in 17% of social media ads case studies, against 11% of PPC ones.
Social media ads conversion and lead statistics
The median reported increase in conversions or leads is 97%. 110 case studies state a percentage gain, with the middle half between 42% and 238%. Taken separately, the median is 96% for conversions (63 case studies) and 98% for leads (48 case studies).
The median reported increase in conversion rate is 54%. 43 case studies state one, with the middle half between 31% and 149%.
The median reported increase in click-through rate is 74%. 35 case studies state one, with the middle half between 36% and 158%.
The median reported increase in website traffic is 104%. 52 case studies state one, with the middle half between 69% and 302%.
Social media engagement and reach statistics
The median reported gain in engagement and reach is 132%. 52 case studies state a percentage gain in followers, engagement, views or reach. The middle half runs from 47% to 479%, the widest range of any metric here. Accounts that start small can multiply their following quickly, so the upper end says more about the starting point than the campaign.
Social media ads statistics by platform
Only 22% of social media ads case studies name a platform in their results. 113 of the 525 mention at least one platform in their result stats. The other 78% describe the outcome without saying where the ads ran.
Meta is named three times as often as TikTok. Facebook, Instagram or Meta appear in the results of 78 case studies, and TikTok in 26. YouTube is named in 9, LinkedIn, Snapchat and X in 5 each, Reddit in 3 and Pinterest in 2.
Meta engagement and reach gains have a median of 166%. 20 case studies state a percentage gain in engagement, reach or impressions on Facebook or Instagram, with the middle half between 90% and 752%.
No other platform has enough data for a benchmark. TikTok has 7 comparable data points and every other platform fewer. We'll add platform figures once each passes 20 data points.
Social media ads statistics by industry
To make 99 industry labels comparable, we rolled them up into 13 groups (see methodology).
Consumer brands buy the most social advertising. Retail & Ecommerce accounts for 19% of social media ads case studies (101) and Fashion, Beauty & Jewelry for 18% (97). Healthcare & Wellness follows at 13%, then Food & Beverage, Software & Technology, and Home, Property & Local Services at 8% each. Fashion is the most common single industry, with 43 case studies.
Retail and ecommerce clients report a median 98% increase in revenue. 50 Retail & Ecommerce case studies state a revenue gain, with the middle half between 46% and 258%. For Fashion, Beauty & Jewelry the median is 80% across 30 case studies, with the middle half between 36% and 174%.
Retail and ecommerce clients report a median 77% increase in ROAS. 20 case studies state one, with the middle half between 32% and 267%.
No industry has enough data yet for a cost or lead benchmark. Healthcare & Wellness comes closest, with 18 case studies each for acquisition cost and for conversions or leads.
Consumer brands report revenue; service businesses report leads. A revenue stat appears in 61% of Retail & Ecommerce case studies, 48% of Fashion, Beauty & Jewelry ones and 41% of Food & Beverage ones. A conversion or lead stat appears in 65% of Education & Nonprofit case studies, 50% of Home, Property & Local Services ones and 48% of Financial Services ones.
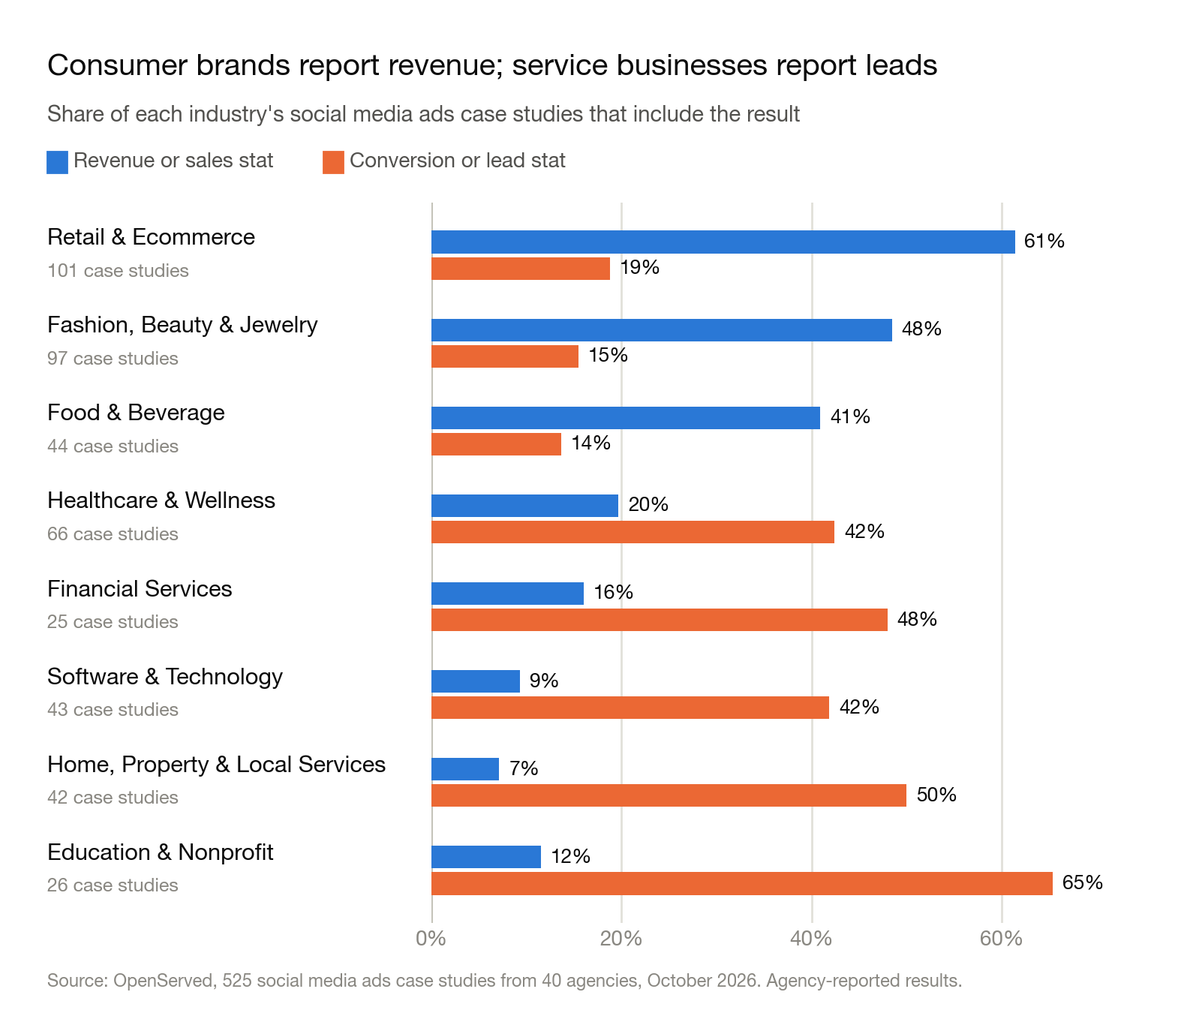
ROAS is an ecommerce metric. A ROAS stat appears in 35% of Fashion, Beauty & Jewelry case studies and 30% of Retail & Ecommerce ones, against 5% of Software & Technology ones.
Food and entertainment brands report reach. An engagement, reach or awareness stat appears in 60% of Media & Entertainment case studies and 48% of Food & Beverage ones, against 21% of Software & Technology ones.
Social media ads statistics by client size
Client size is the client's employee count. It is recorded for 386 of the 525 case studies (74%).
Enterprises are nearly as common as small businesses. Of the 386 with a known size, 131 involve small businesses (1 to 50 employees), 67 medium businesses (51 to 200), 71 large businesses (201 to 1,000) and 117 enterprises (more than 1,000). Enterprises make up 30% here, against 15% of PPC case studies.
Small-business case studies report sales and leads; enterprise ones report reach. A revenue, lead or conversion stat appears in 66% of small-business case studies but only 38% of enterprise ones. An engagement, reach or awareness stat appears in 52% of enterprise case studies but only 27% of small-business ones.
Small businesses report a median 97% gain in conversions or leads and a 48% cut in acquisition cost. 32 small-business case studies state a conversion or lead gain, 20 state a cost cut, and 28 state a revenue gain, with a median of 83%.
Medium businesses report a median 179% gain in conversions or leads. That rests on 20 case studies, with the middle half between 58% and 325%. Large and enterprise clients have too few data points to report.
Smaller clients are more likely to buy social ads on their own. Social Media Ads is the only service in 29% of small-business case studies, 21% of medium, 17% of large and 10% of enterprise ones.
Social media ads statistics by country
Country is the client's location, not the agency's. It is recorded for 439 of the 525 case studies (84%).
85% of social media ads case studies are for US clients. 371 of the 439 located case studies are in the United States. The other 68 are spread across 22 countries and territories, led by the United Kingdom (13) and Canada (7).
US clients report a median 44% cut in acquisition cost and a 97% gain in conversions or leads. 60 US case studies state a cost cut and 86 state a conversion or lead gain. The median reported revenue gain is 95% (77 case studies) and the median ROAS gain is 48% (40).
There isn't enough international data to compare. International case studies have fewer than 10 data points for every metric.
California accounts for 24% of US social media ads case studies. 90 of the 371 are for California clients, followed by Texas (35), Florida (33) and New York (30). California clients report a median 62% cut in acquisition cost (24 case studies), a 92% gain in conversions or leads (22) and a 78% gain in revenue (20).
How long social media ads take: what the data can't tell you
Fewer than 2% of social media ads case studies say how long the work took. Only 10 of the 525 state an engagement length. That is too few to say how fast results arrive, so we don't try.
Only 18% mention any time period at all. 96 case studies include a time reference somewhere in their result stats, such as "year over year" or "in 90 days". The other 82% give a result with no window.
If you're comparing agencies, ask for the timeframe behind every number. A ROAS from one launch weekend is a different result from the same ROAS held for a year.
How social media ads are sold: bundles and agencies
75% of social media ads case studies bundle another service. Only 129 of the 525 list Social Media Ads alone. The average case study lists 2.4 services.
PPC is the most common partner. PPC appears alongside in 39% of social media ads case studies, Content Marketing in 17%, SEO in 15% and Influencer Marketing in 10%.
Social-only case studies report smaller lead gains and larger revenue gains. Where Social Media Ads is the only service, the median gain in conversions or leads is 67% (23 case studies), against 106% where it is bundled (87). For revenue it is the reverse: 128% for social-only case studies (21) against 101% for bundled ones (88).
Three agencies publish 33% of the social media ads case studies. Hawke Media has 61, LYFE Marketing 57 and KlientBoost 54. Half the agencies have six or fewer.
The headline numbers move a little without the largest publisher of each metric. KlientBoost supplies 28 of the 79 cost data points and 40 of the 110 conversion and lead ones; without it, the median cost cut is 50% and the median gain in conversions or leads is 103%. Hawke Media supplies 19 of the 109 revenue data points; without it, the median revenue gain is 98%.
How much of this data is verified?
Only 4% of social media ads case studies are Client-verified. 21 of the 525 carry OpenServed's Client-verified badge, meaning the named client confirmed the results. The other 96% are agency-reported.
There isn't enough verified data yet to compare the two. No metric has more than 4 verified data points. We'll report the comparison once the verified group is large enough.
Keep this in mind with every number on this page. A published case study is an agency's best work, described in the agency's words. Without a client confirming it, it's a claim, not a benchmark.
What this means if you're hiring a social media ads agency
- Treat a 45% cut in acquisition cost and a doubling of revenue as the typical published win, not a promise. Case studies are the campaigns that went well.
- Ask for a business outcome, not only reach. 43% of social media ads case studies report no revenue, lead or conversion result. Engagement is easy to grow and hard to bank.
- Ask how ROAS was counted. Quoted ROAS figures have a median of 8.0x. Ask which attribution window was used and whether view-through conversions are included.
- Ask which platform the result came from. 78% of case studies don't say. Results on Meta and TikTok are not interchangeable.
- Ask which service did the work. 75% of these case studies bundle other services, and 39% include PPC.
- Match the goal to your size. Enterprise case studies mostly show reach; small-business ones mostly show sales and leads. Make sure the agency's proof fits the result you need.
- Ask for the timeframe, and whether the client confirmed it. Fewer than 2% of case studies state a duration, and only 4% are Client-verified.
You can browse every case study behind these numbers in OpenServed's social media ads agency directory, and filter by industry, client size and location.
Methodology
- Source: all 525 case studies in OpenServed's directory that list Social Media Ads as a service, as of October 5, 2026, from 40 agencies. Each links to the agency's own published case study. Case studies that list only Influencer Marketing, Community Engagement or YouTube Advertising are not included.
- Result stats: each case study carries the result stats the agency published, as free text. We assigned each stat to a metric by keyword matching: cost per acquisition, cost per lead, cost per click, ROAS, conversion rate, click-through rate, revenue, leads, conversions, traffic, impressions, and engagement and reach.
- Percentages only: medians use stats that state a percentage change. Plain counts, dollar figures and before-and-after pairs are left out. The one exception is the ROAS figure, read from stats such as "6x ROAS".
- Direction: cost metrics count reductions; every other metric counts increases. Claimed cost reductions above 100% are excluded as impossible. Comparisons with a goal, target or industry average are left out.
- Other channels excluded: stats that name another channel, such as Google, paid search, PPC, organic search, SEO, email or Amazon, are not counted as social media ads results. That removes 11% of all stats.
- Platforms: a case study counts toward a platform when one of its result stats names it. Facebook, Instagram and Meta are counted together.
- One data point per case study: if a case study has several stats for the same metric, we use the first one listed. Conversions and leads are combined, using whichever comes first.
- Median and middle half: we report the median, not the average, because a handful of gains above 1,000% would distort an average. The middle half is the range from the 25th to the 75th percentile.
- Minimum sample: we report a segment only when it has at least 20 data points for that metric.
- Bundled services: 75% of these case studies list other services alongside Social Media Ads. Revenue, lead and conversion stats may reflect other channels unless the stat names social.
- Industry groups: we merged 99 industry labels into 13 groups for the roll-up figures. Client size uses employee count: small is 1 to 50, medium 51 to 200, large 201 to 1,000 and enterprise more than 1,000.
- Selection bias: agencies publish their wins, and the directory is not a random sample of the industry. Three agencies account for 33% of these case studies.
- Agency-reported: except for the 21 Client-verified case studies, results are as published by each agency and haven't been independently confirmed.
Cite this data: OpenServed, "Social Media Ads Statistics 2026: Results From 500+ Agency Case Studies", October 2026, https://openserved.com/blog/social-media-ads-statistics
FAQs
How many social media ads case studies did you analyze?
525 case studies from 40 agencies, as of October 2026. Each one lists Social Media Ads as a service and links to the agency's own published case study.
What is a good result from social media ads?
The median case study reports a 45% cut in cost per acquisition or lead, a 106% increase in revenue and a 97% increase in conversions or leads. These are published wins, so a typical campaign is likely to land lower.
What is a good ROAS for social media ads?
Where agencies state a ROAS figure, the median is 8.0x and half fall between 3.0x and 13.7x. Only 41 case studies give one, and agencies quote ROAS when it looks good, so read it as a best case.
Which social media platform gets the best results?
The data can't say. Only 22% of case studies name a platform in their results. Meta is named in 78 and TikTok in 26, and no platform has enough comparable data points for a like-for-like benchmark.
Which industries use social media ads most?
Retail and ecommerce (19% of case studies) and fashion, beauty and jewelry (18%). Retail and ecommerce clients report a median 98% increase in revenue.
Are social media ads worth it for small businesses?
Small businesses with 1 to 50 employees are 34% of case studies with a known size. They report a median 97% gain in conversions or leads and a 48% cut in acquisition cost.
How long do social media ads take to work?
This dataset can't answer that. Fewer than 2% of case studies say how long the engagement ran, and only 18% mention any time period in their results.
Are these results verified?
Mostly not. Only 4% of social media ads case studies carry the Client-verified badge. The rest are reported by the agency and haven't been confirmed by the client.