
Content Marketing vs Social Media Ads: Results From 2,600+ Agency Case Studies
16 min readLast updated November 3, 2026
On this page
- Content marketing vs social media ads at a glance
- The short answer
- What content marketing and social media ads case studies report
- Content marketing vs social media ads results on shared metrics
- What each channel measures on its own
- Content marketing vs social media ads by industry
- Content marketing vs social media ads by client size
- What happens when content marketing and social media ads are combined
- What the data can't tell you
- Content marketing or social media ads: which should you choose?
- Methodology
- FAQs
Content marketing and social media ads both promise attention. One earns it with articles, video and social posts people choose to read; the other buys it in the feed. Most comparisons stop at how the two work. Very few show what each one delivered for real clients.
This page compares them with data. It draws on 2,622 case studies from 259 marketing agencies in OpenServed's directory: 1,653 that list content marketing, 1,261 that list social media ads, and 292 that list both. For the head-to-head we use the 1,361 case studies that list content marketing without social media ads and the 969 that list social media ads without content marketing. We don't use single-service case studies here, as some of our other comparisons do, because the 310 that list content marketing alone include too few numbers to compare.
Data as of November 2026. These are results agencies chose to publish, so they show what a successful campaign looks like, not what an average one does. If you cite a number, please cite the date.
Content marketing vs social media ads at a glance
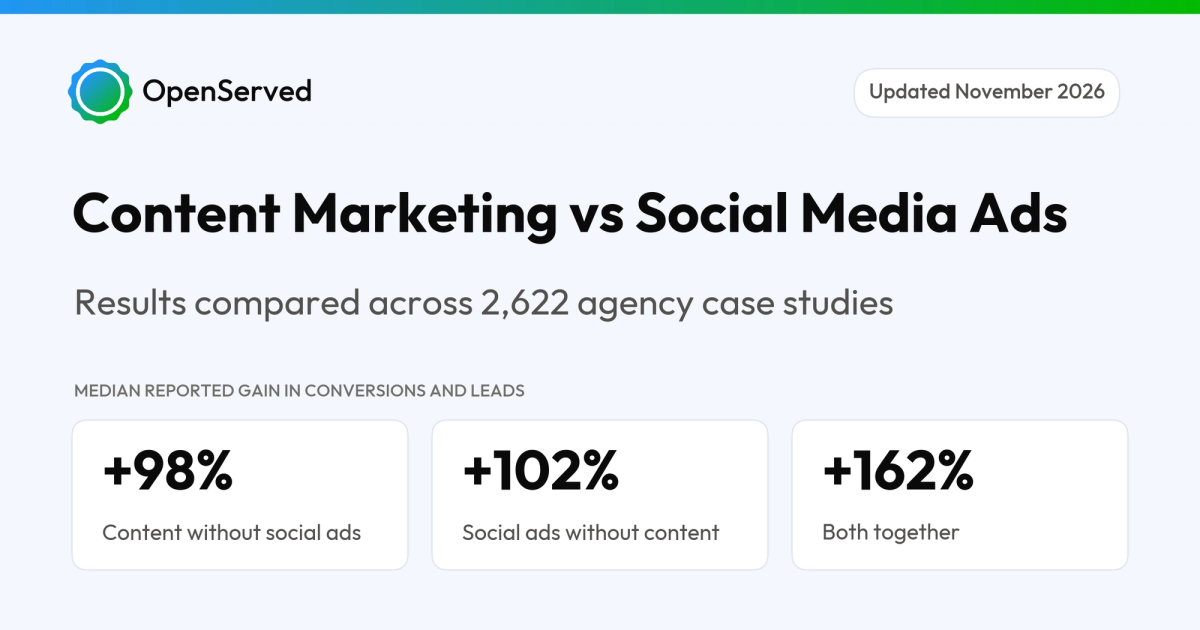
- On conversions and leads, the two are level: a median 98% increase for content marketing case studies and 102% for social media ads ones.
- Social ads lead on revenue: a median 102% increase against 76% for content marketing.
- Content marketing leads on traffic: a median 119% increase in website traffic against 92% for social ads.
- Both report reach, and content's engagement gains are a little larger. The median gain in engagement and reach is 130% for content marketing and 113% for social ads.
- Social ads case studies are far more likely to prove a business result. 57% report revenue, leads or conversions, against 33% of content marketing case studies.
- Only social ads case studies show what a result cost. 22% report a cost per acquisition or lead and 20% report ROAS. Under 1% of content marketing case studies report either.
- Social ads report bigger lead gains at every client size, from 97% against 80% for small businesses to 96% against 65% for enterprises.
- B2B firms use content marketing; fashion and food brands use social ads. Software companies list content marketing three times as often as social ads. Fashion brands list social ads almost three times as often.
- The data can't measure ROI or speed. Only 1 of the 2,622 case studies states a budget, and only 11 say how long the work took.
The short answer
Neither channel wins outright. On leads they are level. Social ads case studies report larger revenue gains, are much more likely to show a business result, and are the only ones that show what a customer cost. Content marketing case studies report larger traffic gains and rank in search, which social ads don't. If you sell to consumers and need sales you can measure, social ads have the stronger record. If you sell to businesses or need traffic that keeps coming, content marketing is the more common choice. The last section of this page turns that into a choice.
What content marketing and social media ads case studies report
Before comparing results, look at what each channel's case studies choose to show. The two are sold and proven in different ways.
Content marketing case studies report traffic; social ads case studies report sales and cost. Share of case studies that include each result:
- Website traffic: 36% of content marketing, 16% of social media ads
- Keyword rankings: 21% of content marketing, 1% of social media ads
- Conversions or leads: 23% of content marketing, 30% of social media ads
- Revenue or sales: 13% of content marketing, 34% of social media ads
- Cost per acquisition or lead: under 1% of content marketing, 22% of social media ads
- ROAS: none of content marketing, 20% of social media ads
- Social engagement and reach: 14% of content marketing, 20% of social media ads
- Impressions: 16% of content marketing, 12% of social media ads
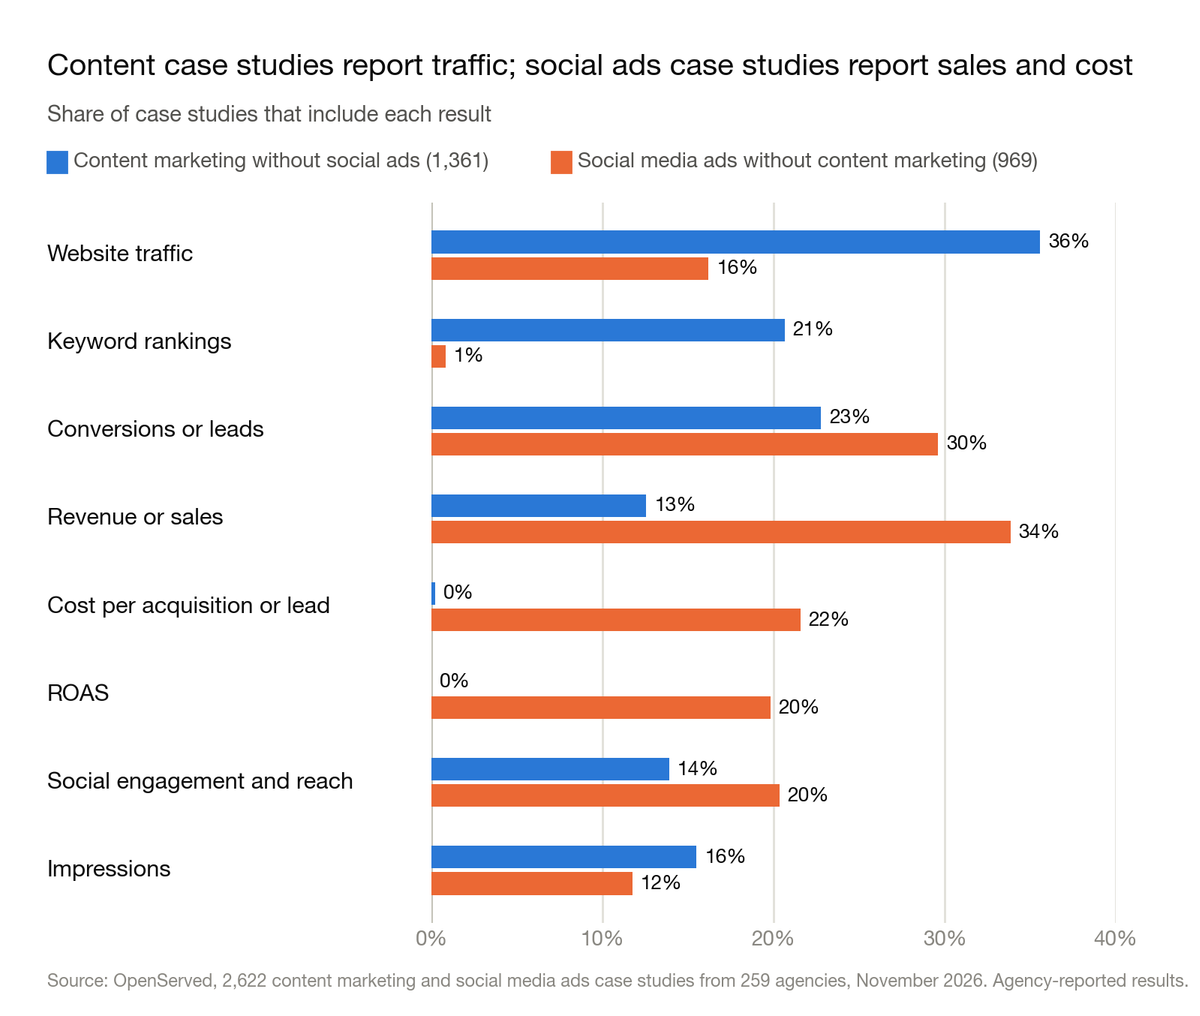
Social ads case studies are much more likely to show a business result. 57% of social ads case studies report revenue, leads or conversions. For content marketing case studies it is 33%.
Cost is almost never part of a content marketing case study. 42% of social ads case studies report an efficiency metric such as cost per acquisition, cost per click or ROAS. Only 2% of content marketing case studies do.
Both channels report reach about equally often. An engagement, reach, impressions or awareness result appears in 27% of content marketing case studies and 29% of social ads ones.
Content marketing case studies are more likely to have no number at all. 16% of them report no figure of any kind, against 4% of social ads case studies.
Content marketing vs social media ads results on shared metrics
Traffic, leads, revenue and engagement mean the same thing for both channels, so they can be compared directly. Content marketing traffic and engagement are mostly organic; social ads traffic and engagement come from paid campaigns.
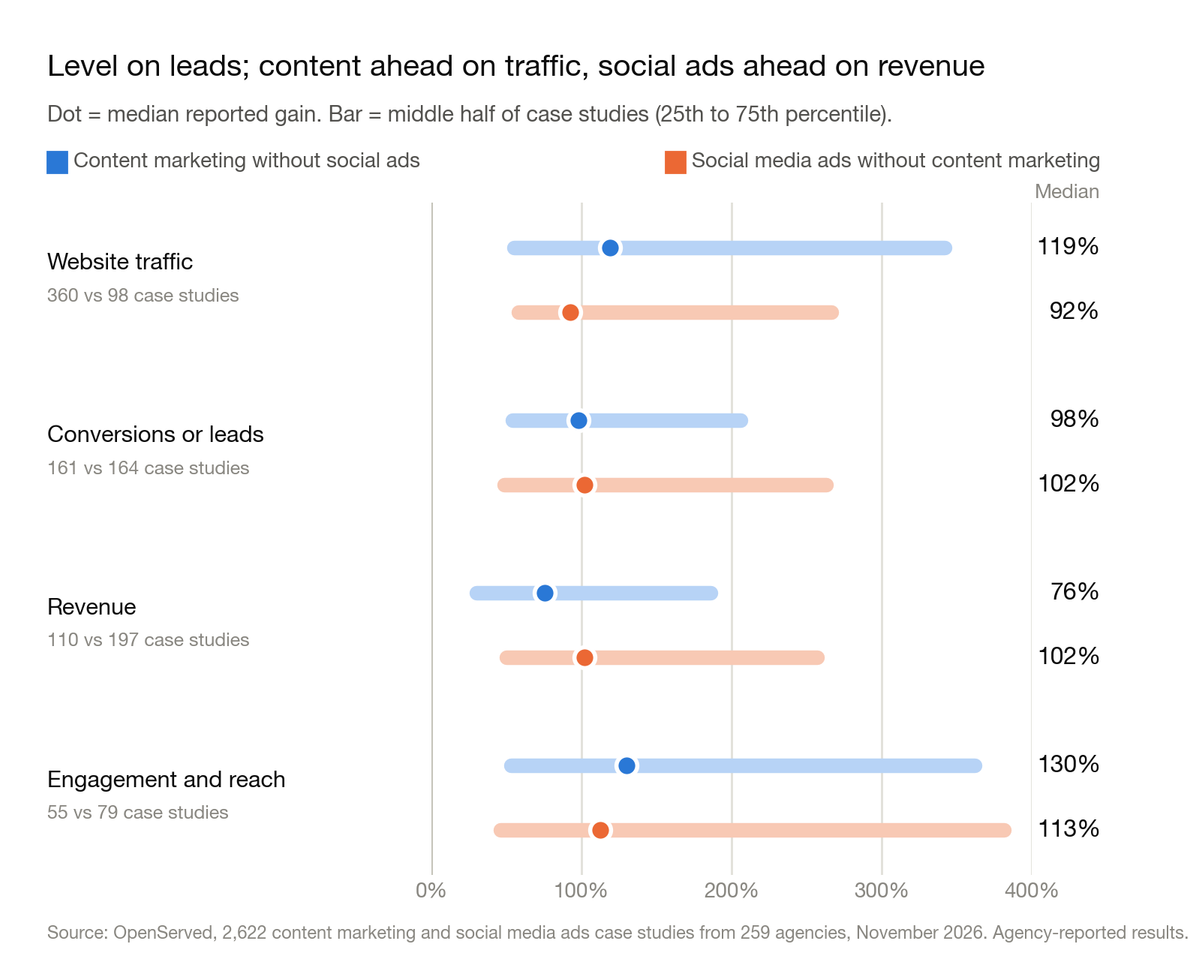
The two are level on leads; content marketing is ahead on traffic and social ads on revenue. Median reported gain, with the middle half in brackets:
- Website traffic: 119% for content marketing (55% to 342%, 360 case studies), 92% for social media ads (58% to 266%, 98 case studies)
- Conversions or leads: 98% for content marketing (54% to 206%, 161 case studies), 102% for social media ads (48% to 263%, 164 case studies)
- Revenue: 76% for content marketing (30% to 186%, 110 case studies), 102% for social media ads (50% to 257%, 197 case studies)
- Engagement and reach: 130% for content marketing (53% to 362%, 55 case studies), 113% for social media ads (46% to 382%, 79 case studies)
Leads and conversions separately. The median reported gain in leads is 83% for content marketing and 104% for social ads (122 and 92 case studies). For conversions it is 144% and 97% (46 and 75 case studies).
The pattern holds without the largest publisher on each side. Without Siege Media, which supplies 5% of the content marketing case studies, the content medians are 105% for traffic, 98% for conversions or leads and 76% for revenue. Without LYFE Marketing, 6% of the social ads case studies, the social ads figures are 91%, 100% and 102%.
This is not proof that social ads produce more revenue than content marketing. Two things sit behind the gap:
- Different clients. 34% of content marketing clients with a known size are enterprises, against 27% of social ads clients. Across the directory, enterprises report smaller revenue gains than smaller companies do.
- Different goals. Content marketing is often bought for traffic and search visibility, not sales. Its case studies report revenue less than half as often as social ads ones.
What each channel measures on its own
Some results exist for one channel only. They are shown side by side here, not as a contest. These figures come from all case studies that list each channel, and each links to its full breakdown.
Content marketing (Content Marketing Statistics 2026):
- Organic and blog traffic: median reported increase of 130% (265 case studies)
- Keyword rankings: median reported growth of 151% (98 case studies)
Social media ads (Social Media Ads Statistics 2026):
- Cost per acquisition or lead: median reported cut of 42% (147 case studies)
- ROAS: median reported increase of 62% (82 case studies); where agencies state the ROAS itself, the median is 7.6x (113 case studies)
- Click-through rate: median reported increase of 73% (47 case studies)
Content marketing vs social media ads by industry
This section uses every case study that lists each channel, so a case study listing both counts on both sides. We merged industry labels into 13 groups (see methodology).
B2B firms use content marketing; fashion, food and retail brands use social ads. Share of each industry's case studies that list content marketing and social media ads:
- Software & Technology: 29% content marketing, 10% social media ads
- Professional & B2B Services: 25% content marketing, 6% social media ads
- Industrial & Manufacturing: 21% content marketing, 9% social media ads
- Education & Nonprofit: 31% content marketing, 20% social media ads
- Financial Services: 23% content marketing, 13% social media ads
- Healthcare & Wellness: 21% content marketing, 16% social media ads
- Home, Property & Local Services: 19% content marketing, 14% social media ads
- Retail & Ecommerce: 17% content marketing, 20% social media ads
- Food & Beverage: 21% content marketing, 29% social media ads
- Fashion, Beauty & Jewelry: 11% content marketing, 31% social media ads
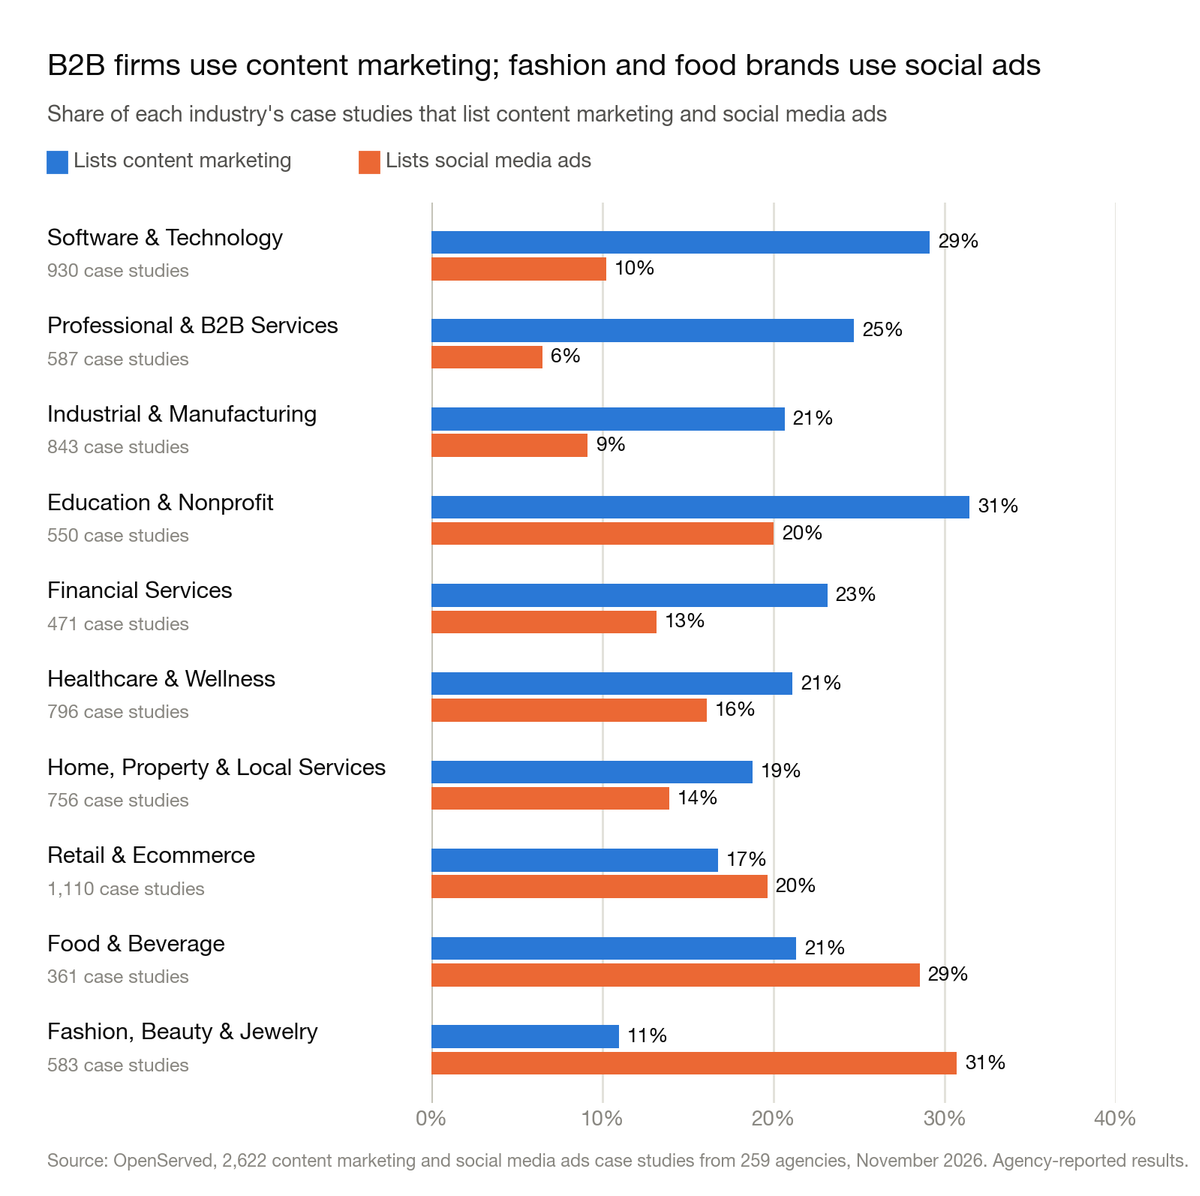
B2B service firms use content marketing about four times as often as social ads, at 25% against 6%. Software and manufacturing use it two to three times as often.
Fashion brands use social ads almost three times as often as content marketing, at 31% against 11%.
Lead gains split by industry. Median reported gain in conversions or leads, for the groups where both channels have at least 20 data points:
- Healthcare & Wellness: 162% for content marketing (30 case studies), 109% for social media ads (31)
- Software & Technology: 100% for content marketing (40), 135% for social media ads (25)
- Home, Property & Local Services: 90% for content marketing (20), 104% for social media ads (20)
Of the three, healthcare is the one where content marketing reports bigger lead gains. In software and home services, social ads are ahead.
For retail, content marketing brings traffic and social ads bring revenue. The median reported traffic gain for Retail & Ecommerce clients is 148% for content marketing (51 case studies) and 108% for social media ads (23). The median revenue gain is 87% for content marketing (49) and 100% for social media ads (87).
Content marketing vs social media ads by client size
This section also uses every case study that lists each channel. Client size is the client's employee count, recorded for 50% of content marketing case studies and 46% of social media ads ones.
Content marketing grows with client size; social ads less so. Share of case studies at each client size that list content marketing and social media ads:
- Small (1 to 50 employees): 15% content marketing, 14% social media ads
- Medium (51 to 200): 24% content marketing, 15% social media ads
- Large (201 to 1,000): 26% content marketing, 18% social media ads
- Enterprise (more than 1,000): 32% content marketing, 20% social media ads
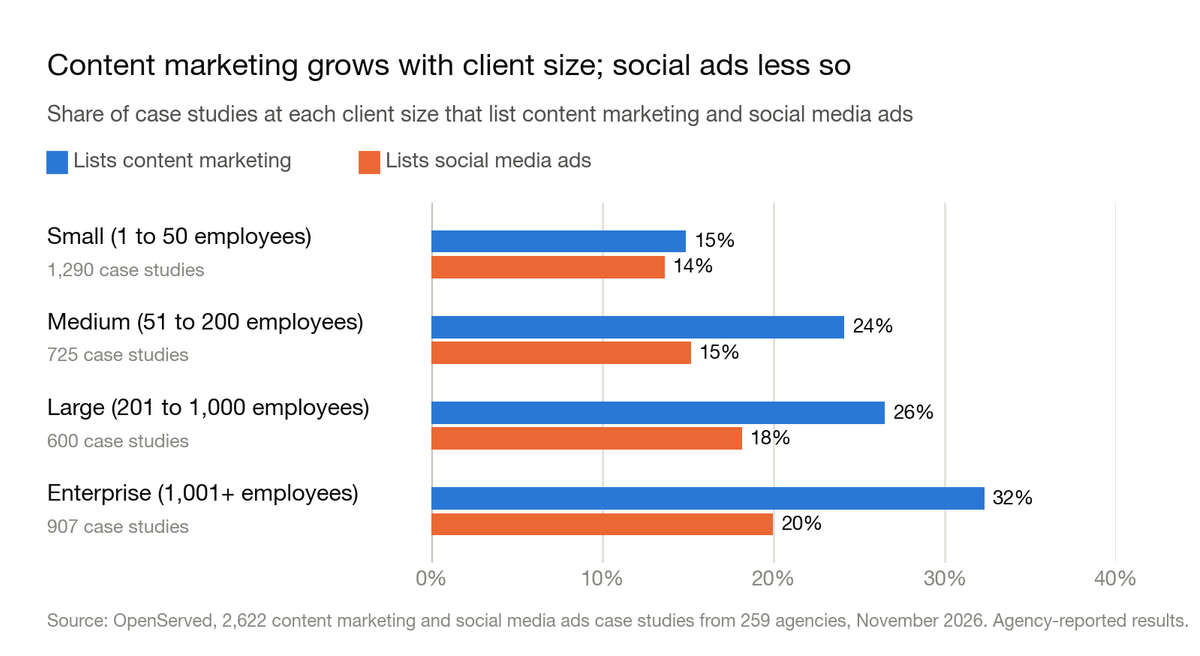
Small businesses use the two equally, at 15% and 14%. From medium-sized businesses up, content marketing is listed more often.
Social ads report bigger lead gains at every client size. Median reported gain in conversions or leads:
- Small: 80% for content marketing (37 case studies), 97% for social media ads (37)
- Medium: 154% for content marketing (22), 167% for social media ads (23)
- Large: 83% for content marketing (25), 90% for social media ads (26)
- Enterprise: 65% for content marketing (25), 96% for social media ads (22)
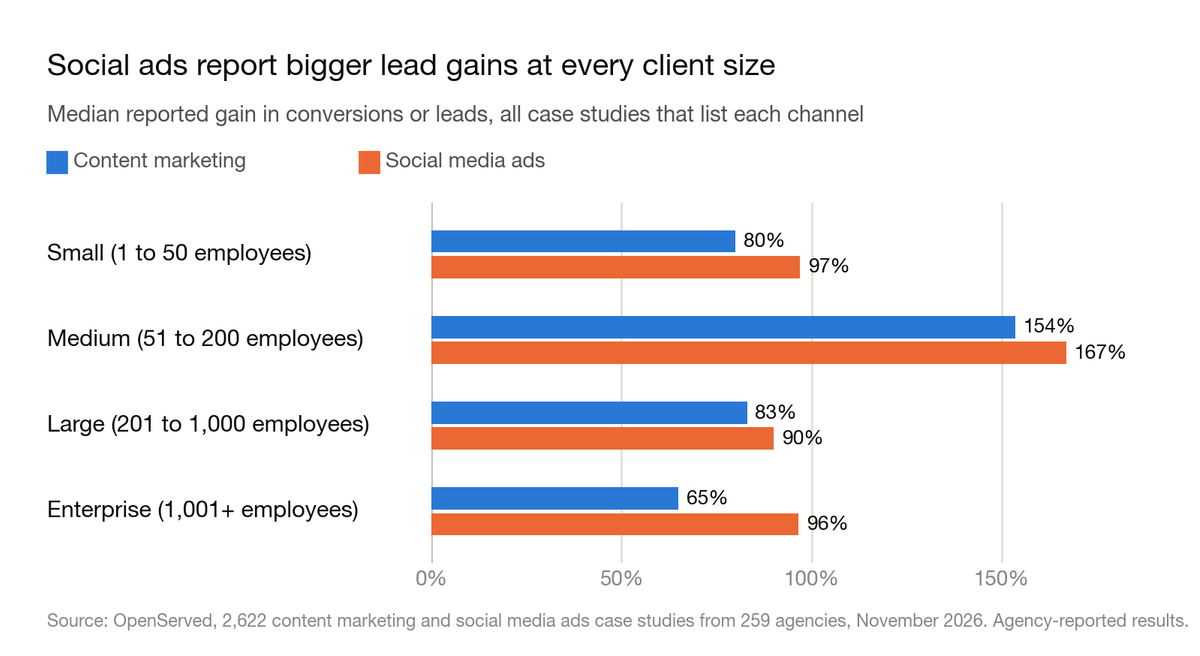
The gap is widest for enterprises, on revenue too. The median reported revenue gain for enterprises is 36% for content marketing (21 case studies) and 80% for social media ads (20). For small businesses it is 85% and 100% (20 and 39).
Social ads case studies show a business result more often at every size. The share that report revenue, leads or conversions is 43% for content marketing and 66% for social ads among small businesses, and 28% and 37% among enterprises.
Enterprises use both for reach. An engagement, reach or awareness result appears in 46% of enterprise content marketing case studies and 50% of enterprise social ads ones.
What happens when content marketing and social media ads are combined
Combining the two is common. 292 case studies list both: 18% of all content marketing case studies and 23% of all social media ads ones. 160 of them list these two services and nothing else, and 44% of combined clients with a known size are enterprises.
Combined case studies are campaigns for attention. 64% report engagement, reach, impressions or awareness, against 27% of content marketing and 29% of social ads case studies on their own. 49% report social engagement or reach. Only 32% report a business result.
Combined case studies report the largest lead gains, on few data points. Median reported gain, with the middle half in brackets:
- Conversions or leads: 162% together (32% to 278%, 24 case studies), 98% for content marketing, 102% for social ads
- Revenue: 94% together (51% to 204%, 24 case studies), 76% for content marketing, 102% for social ads
- Website traffic: 106% together (52% to 260%, 33 case studies), 119% for content marketing, 92% for social ads
- Engagement and reach: 118% together (55% to 443%, 44 case studies), 130% for content marketing, 113% for social ads
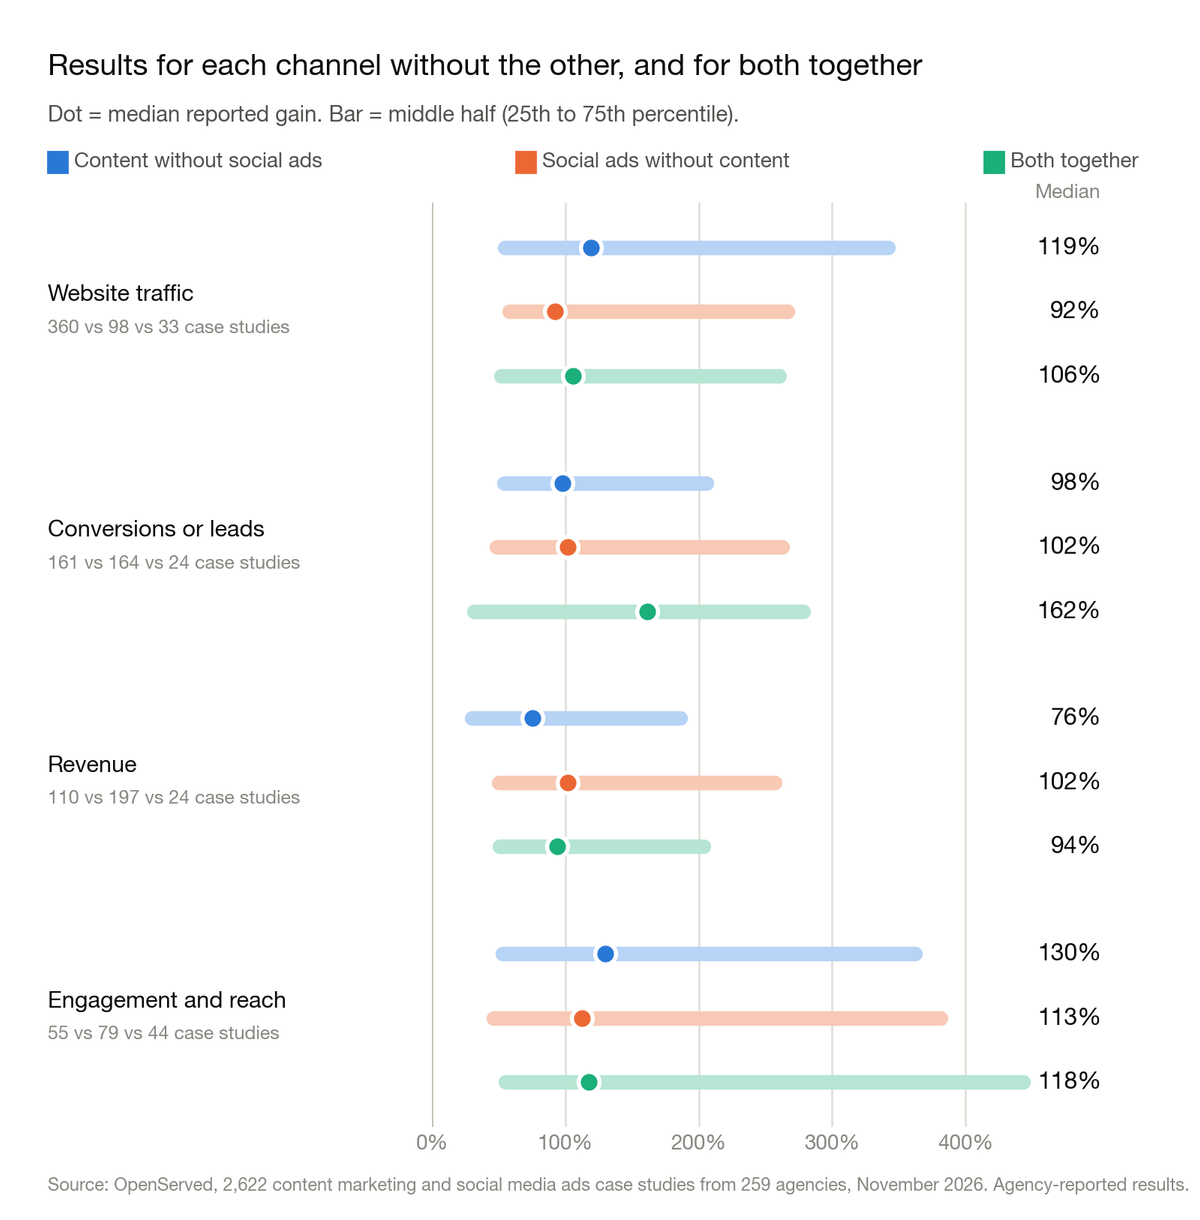
Revenue, traffic and engagement gains fall between the two. Only leads stand out, and that figure rests on 24 data points with a wide middle half. Read it as what agencies report from a combined campaign, not as proof that the two channels multiply each other.
What the data can't tell you
It can't measure ROI. Only 1 of the 2,622 case studies states a budget. Without spend, there is no way to compare what each channel returned per dollar.
It can't measure speed. Only 11 case studies say how long the work took. A time period of any kind appears in the results of 20% of content marketing case studies and 22% of social ads ones.
It only shows wins. Agencies publish their best work, and only 202 of the 2,622 case studies (7.7%) are Client-verified. Every number here is a published best case, not a typical outcome.
General context, not from this data: social ads can reach people the day a campaign goes live, and the reach stops when the spend stops. Content usually takes months to build an audience, and articles that rank can keep bringing visitors after the work ends. Those differences matter for the choice below, but our case studies can't put a number on them.
Content marketing or social media ads: which should you choose?
The data doesn't pick a winner, but it does show where each channel has the stronger record.
- If you need sales you can measure, social ads have the proof. 57% of social ads case studies report a business result and 22% report what a customer cost. Content marketing case studies rarely show either.
- If you sell fashion, food or other consumer products, social ads are the more common choice. Fashion brands list social ads almost three times as often as content marketing, and retail clients report bigger revenue gains from social ads.
- If you sell to businesses, content marketing is the usual tool. Software, B2B services and manufacturing firms list content marketing two to four times as often as social ads.
- If you want search traffic, choose content marketing. 21% of content marketing case studies report keyword rankings; social ads case studies almost never do.
- If you're in healthcare, look hard at content marketing. It is the one industry we can compare where content marketing case studies report bigger lead gains, 162% against 109%.
- If you're a small business, either can work. Small businesses use the two equally, and social ads report slightly bigger lead gains, 97% against 80%.
- If you need attention quickly, social ads are the usual answer. That comes from how the channels work, not from this data.
Whichever you choose, ask an agency for three things most case studies leave out: a business result, what it cost, and how long it took.
You can browse the case studies behind these numbers in OpenServed's content marketing agency directory and social media ads agency directory, and filter by industry, client size and location. For related comparisons, see SEO vs Content Marketing, Content Marketing vs PPC, SEO vs Social Media Ads and PPC vs Social Media Ads.
Methodology
- Source: all 2,622 case studies in OpenServed's directory that list Content Marketing, Social Media Ads or both, as of November 2, 2026, from 259 agencies: 1,653 list Content Marketing, 1,261 list Social Media Ads and 292 list both. Each links to the agency's own published case study.
- Head-to-head groups: the comparison uses the 1,361 case studies that list Content Marketing but not Social Media Ads, and the 969 that list Social Media Ads but not Content Marketing. Each may list other services too. We didn't use single-service case studies because the 310 that list Content Marketing alone include too few results: 31 traffic results and 10 lead or conversion results.
- All case studies: the industry and client-size sections use every case study that lists each channel. A case study that lists both counts toward both.
- One set of metric rules: each case study carries the result stats the agency published, as free text. We assigned each stat to a metric by keyword matching, using the same rules for both channels.
- Other channels excluded: each side leaves out stats that name another channel, using the same rules as our statistics pages. Content marketing results leave out stats that name paid media, ads, cost per acquisition, ROAS, email or Amazon. Social media ads results leave out stats that name Google, paid search, PPC, organic search, SEO, email or Amazon. Case studies that list both leave out stats that name paid search, email, Amazon or another third channel.
- Percentages only: medians use stats that state a percentage change. Plain counts, dollar figures and before-and-after pairs are left out, though they still count toward what case studies report.
- Direction: cost metrics count reductions; every other metric counts increases. Comparisons with a goal, target or industry average are left out.
- One data point per case study: if a case study has several stats for the same metric, we use the first one listed. "Conversions or leads" uses whichever comes first.
- Median and middle half: we report the median, not the average, because a handful of gains above 1,000% would distort an average. The middle half is the range from the 25th to the 75th percentile.
- Minimum sample: we compare the two channels on a metric or segment only when both have at least 20 data points.
- Channel-specific figures: the figures under "What each channel measures on its own" are quoted from our content marketing and social media ads statistics pages.
- Industry groups: we merged industry labels into 13 groups. Client size uses employee count: small is 1 to 50, medium 51 to 200, large 201 to 1,000 and enterprise more than 1,000.
- Missing details: client size is recorded for 50% of the content marketing case studies and 46% of the social media ads case studies in the head-to-head, so size figures cover only the case studies that have it.
- Selection bias: agencies publish their wins, and the directory is not a random sample of the industry. No single agency supplies more than 7% of any group.
- Agency-reported: except for the 202 Client-verified case studies, results are as published by each agency and haven't been independently confirmed.
Cite this data: OpenServed, "Content Marketing vs Social Media Ads: Results From 2,600+ Agency Case Studies", November 2026, https://openserved.com/blog/content-marketing-vs-social-media-ads
FAQs
Is content marketing or social media advertising better?
Neither wins outright. On conversions and leads they are level (98% vs 102%). Social ads case studies report larger revenue gains (102% vs 76%) and are far more likely to show a business result. Content marketing case studies report larger traffic gains (119% vs 92%).
Which has better ROI, content marketing or social media ads?
This data can't say. Only 1 of 2,622 case studies states a budget, so return per dollar can't be calculated for either channel. Be wary of any source that claims a precise ROI comparison without spend data.
Is content marketing or social media advertising better for small businesses?
Small businesses use the two equally: content marketing appears in 15% of small-business case studies and social ads in 14%. Social ads report a slightly bigger median lead gain, 97% against 80%.
Is content marketing or social media advertising better for ecommerce?
For retail and ecommerce clients, social ads case studies report a larger median revenue gain, 100% against 87%. Content marketing case studies report a larger traffic gain, 148% against 108%.
Is content marketing or social media advertising better for B2B?
B2B firms use content marketing far more often. Software, B2B services and manufacturing companies list it two to four times as often as social ads. On leads, results are mixed: social ads report bigger gains in software, and content marketing in healthcare.
Should I do content marketing and social media ads together?
292 case studies combine the two, most often for reach: 64% report engagement, reach, impressions or awareness. They report the largest lead gains, a median 162%, but on only 24 data points. Revenue, traffic and engagement gains fall between the two channels.
Which is faster, content marketing or social media ads?
Social ads are generally faster to start, because ads can run as soon as a campaign is live. This dataset can't measure it: only 11 of 2,622 case studies say how long the work took.