
Content Marketing Statistics 2026: Results From 500+ Agency Case Studies
14 min readLast updated October 9, 2026
On this page
- Content marketing statistics at a glance
- What content marketing case studies report
- Content marketing traffic statistics
- Content marketing keyword ranking statistics
- Content marketing lead and revenue statistics
- Content marketing engagement and reach statistics
- Content marketing with SEO vs without SEO
- How content marketing is sold
- Content marketing statistics by industry
- Content marketing statistics by client size
- Content marketing statistics by country
- How long content marketing takes: what the data can't tell you
- The agencies behind the data
- How much of this data is verified?
- What this means if you're hiring a content marketing agency
- Methodology
- FAQs
Most content marketing statistics come from surveys: how many marketers have a documented strategy, how often they publish, what they plan to spend. They don't tell you what a content program actually produced for a client.
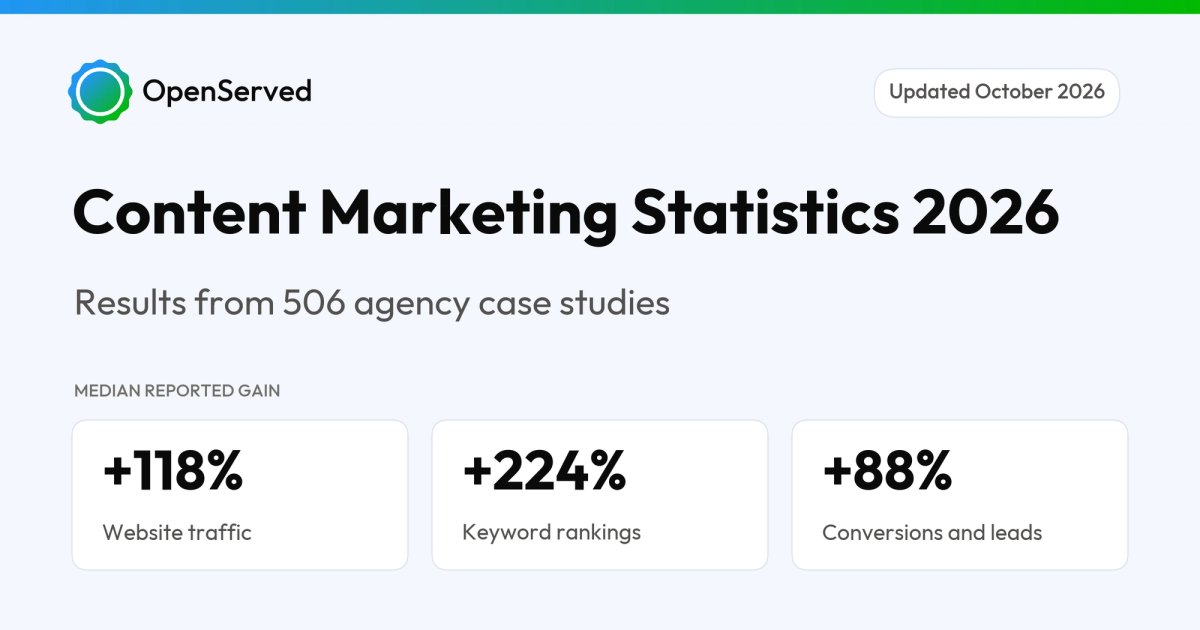
This page does. Every number below is counted from 506 content marketing case studies published by 48 marketing agencies, all indexed in OpenServed's directory. Each case study names a client and states the results the agency reported: traffic, rankings, leads, revenue, engagement and reach.
Data as of October 2026. These are results agencies chose to publish, so they show what a successful content program looks like, not what an average one does. The directory keeps growing, so if you cite a number, please cite the date.
Content marketing statistics at a glance
- 506 content marketing case studies from 48 agencies, covering 101 industries and clients in 25 countries and territories.
- 118% is the median reported increase in website traffic. Half of the 211 case studies that state one fall between 53% and 314%.
- 56% of those case studies report that traffic at least doubled.
- 224% is the median reported growth in keyword rankings, across 50 case studies.
- 88% is the median reported increase in conversions or leads (80 case studies) and 88% in revenue (52 case studies).
- 132% is the median reported gain in engagement, reach or impressions, across 55 case studies.
- 46% of content marketing case studies also list SEO. Those report traffic and rankings; the other 54% report reach more often than traffic.
- Only 8% are about content marketing alone.
- Enterprises are the largest client group, at 34% of case studies with a known size.
- Only 2% are Client-verified, and just 1 case study says how long the work took.
What content marketing case studies report
Traffic is the result agencies report most. 54% of content marketing case studies include a website traffic stat, and 38% specify organic or blog traffic. An engagement, reach or awareness stat appears in 31%, keyword rankings in 26% and conversions or leads in 24%. PR or earned media appears in 20%, revenue or sales in 15%, backlinks in 13% and a count of content produced in 12%.
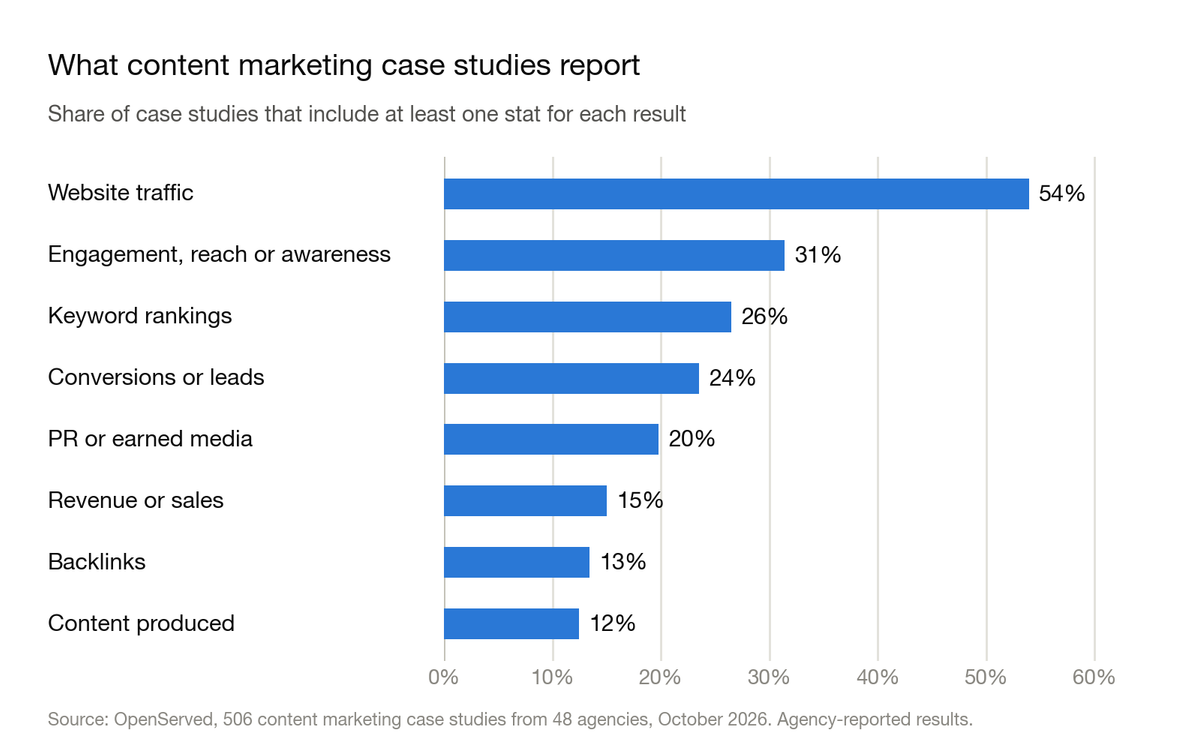
Only 37% report a business outcome. That means revenue, leads or conversions. The other 63% stop at traffic, rankings, reach or output.
Content marketing results are often counts, not percentages. Only 56% of result stats are percentages, the lowest share of any service we've analyzed. Another 37% are plain counts, such as "190 new backlinks" or "1.1 billion earned media impressions". The 506 case studies carry 1,676 result stats, an average of 3.3 each.
Content marketing traffic statistics
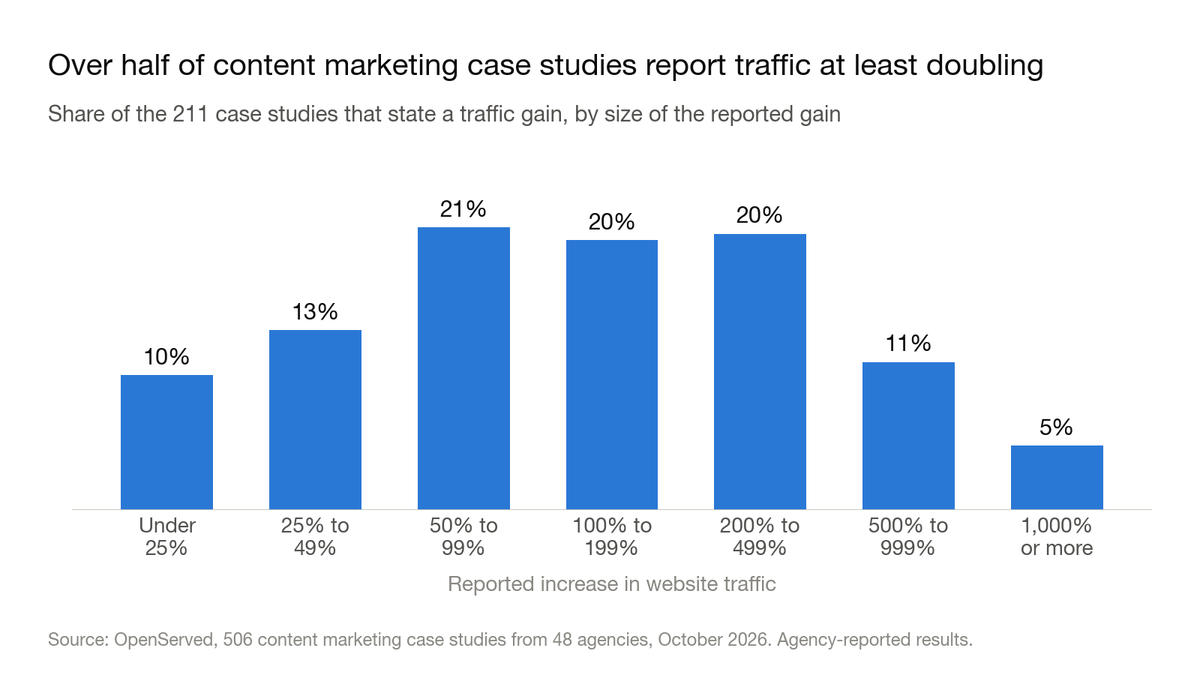
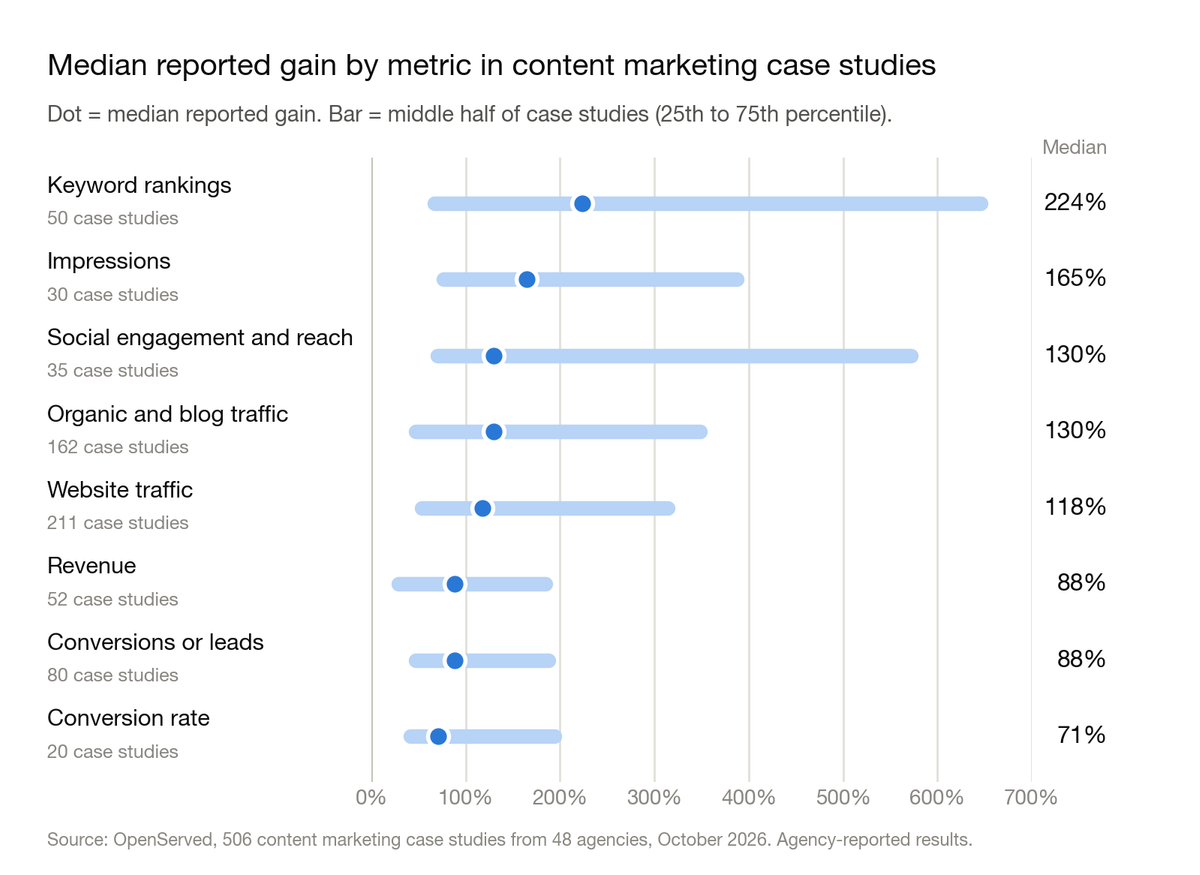
The median content marketing case study reports a 118% increase in website traffic. 211 case studies state a percentage gain in traffic, sessions or users. A quarter report 53% or less, and a quarter report 314% or more.
56% report that traffic at least doubled. The full spread:
- Under 25%: 10% of case studies
- 25% to 49%: 13%
- 50% to 99%: 21%
- 100% to 199%: 20%
- 200% to 499%: 20%
- 500% to 999%: 11%
- 1,000% or more: 5%
Organic and blog traffic grows more than traffic overall. Where the stat specifies organic, search or blog traffic, the median gain is 130% across 162 case studies, with the middle half between 47% and 348%.
10 case studies claim traffic growth of 1,000% or more. Numbers like these come from blogs that started with almost no traffic, so read them as a sign of a small starting point, not as a benchmark.
Content marketing keyword ranking statistics
The median reported growth in keyword rankings is 224%. 50 case studies state a percentage gain in keywords or rankings. The middle half runs from 66% to 646%, and 9 of the 50 claim 1,000% or more. Keyword counts start small, so percentages inflate fast.
Content marketing lead and revenue statistics
The median reported increase in conversions or leads is 88%. 80 case studies state a percentage gain, with the middle half between 47% and 188%. Taken separately, the median is 73% for leads (51 case studies) and 120% for conversions (34 case studies).
The median reported increase in revenue is 88%. 52 case studies state one, with the middle half between 28% and 185%.
The median reported increase in conversion rate is 71%. 20 case studies state one, with the middle half between 42% and 194%.
Content marketing engagement and reach statistics
The median reported gain in engagement, reach or impressions is 132%. 55 case studies state one, with the middle half between 70% and 376%. Taken separately, the median is 165% for impressions (30 case studies) and 130% for social engagement and reach (35 case studies).
Content marketing with SEO vs without SEO
Content marketing is sold in two different ways. 232 of the 506 case studies (46%) also list SEO as a service, and 274 (54%) don't. The two groups report different results for different clients.
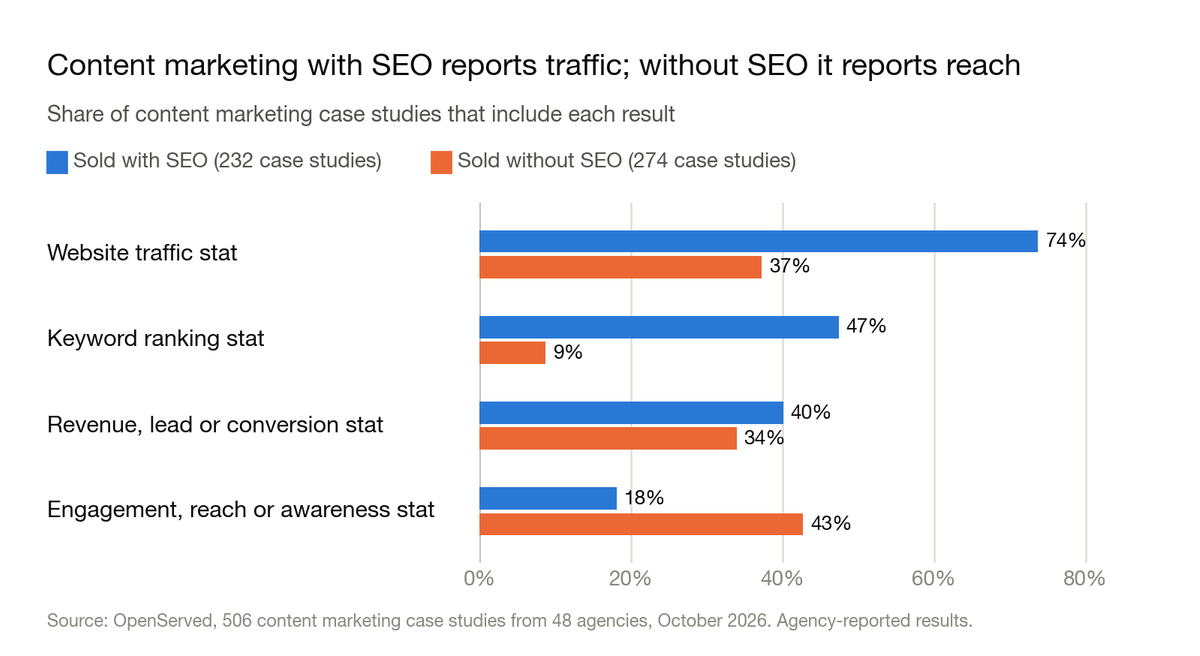
With SEO, agencies report traffic and rankings. Without SEO, they report reach. A traffic stat appears in 74% of case studies that include SEO, against 37% of those that don't. A keyword ranking stat appears in 47% against 9%. An engagement, reach or awareness stat goes the other way: 18% with SEO against 43% without.
The clients are different too. Where content marketing is sold with SEO, 37% of clients with a known size are small businesses and 20% are enterprises. Without SEO, 45% are enterprises and 14% are small businesses.
With SEO, reported revenue and lead gains are higher. The median reported revenue gain is 112% with SEO (28 case studies) against 58% without (24). For conversions or leads it is 98% with SEO (40 case studies) against 80% without (40).
Traffic gains are higher without SEO, on fewer data points. The median reported traffic gain is 144% without SEO (62 case studies, middle half 76% to 278%) against 105% with SEO (149 case studies, middle half 46% to 323%).
Keyword gains come almost entirely from the SEO group. 40 of the 50 keyword data points are from case studies that include SEO, with a median gain of 230%.
How content marketing is sold
92% of content marketing case studies bundle another service. Only 41 of the 506 list Content Marketing alone. The average case study lists 2.5 services.
SEO is the most common partner by far. SEO appears alongside in 46% of content marketing case studies, Social Media Ads in 17%, PPC in 10%, Web Design in 10%, Influencer Marketing in 8% and Branding in 7%.
Content marketing statistics by industry
To make 101 industry labels comparable, we rolled them up into 13 groups (see methodology).
Software and technology companies are the biggest buyers. Software & Technology accounts for 21% of content marketing case studies (104), followed by Retail & Ecommerce (15%), Home, Property & Local Services (9%), Healthcare & Wellness (9%) and Financial Services (8%). SaaS alone is 12%, with 62 case studies.
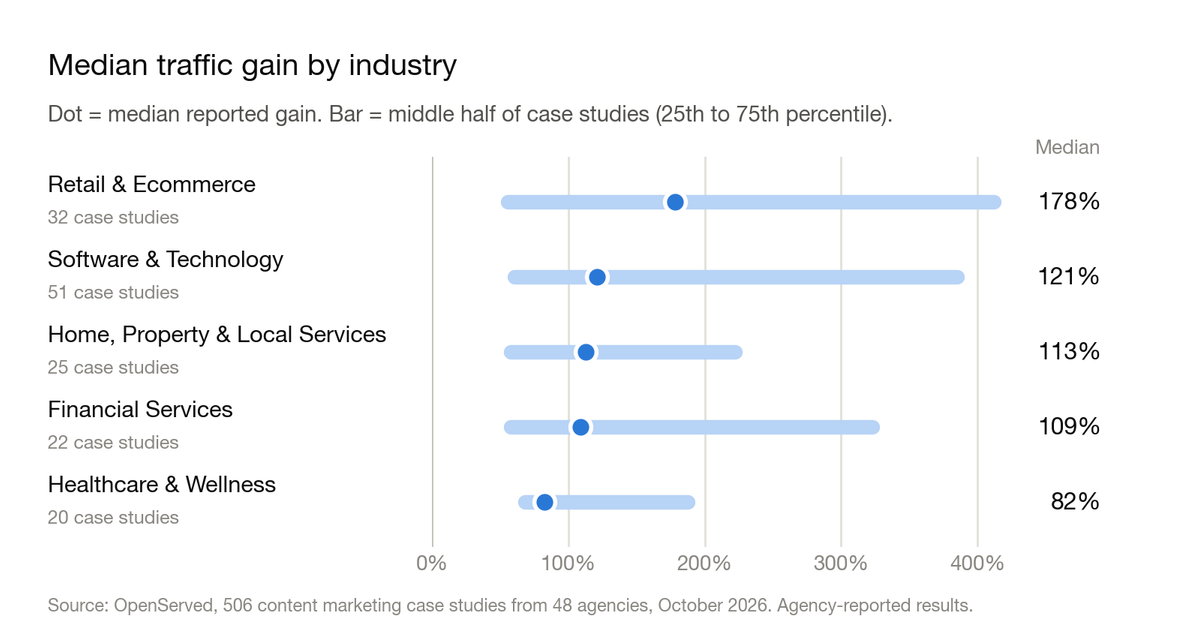
Retail and ecommerce clients report the highest median traffic gain, at 178%. Median reported traffic gain for the five groups with at least 20 data points, with the middle half in brackets:
- Retail & Ecommerce: 178% (56% to 412%), 32 case studies
- Software & Technology: 121% (60% to 385%), 51 case studies
- Home, Property & Local Services: 113% (58% to 222%), 25 case studies
- Financial Services: 109% (58% to 323%), 22 case studies
- Healthcare & Wellness: 82% (68% to 188%), 20 case studies
SaaS content marketing case studies report a median 121% increase in traffic. 37 of the 62 SaaS case studies state a traffic gain, with the middle half between 63% and 407%.
Software and technology clients report a median 101% gain in conversions or leads. 21 case studies state one, with the middle half between 58% and 186%. No other group has 20 data points.
Retail and ecommerce clients report a median 94% increase in revenue. 27 case studies state one, with the middle half between 34% and 180%. No other group has 20 data points.
B2B firms report traffic; fashion brands report reach. A traffic stat appears in 80% of Professional & B2B Services case studies but only 19% of Fashion, Beauty & Jewelry ones. An engagement, reach or awareness stat appears in 56% of Fashion, Beauty & Jewelry case studies but only 13% of Professional & B2B Services ones.
Content marketing statistics by client size
Client size is the client's employee count. It is recorded for 448 of the 506 case studies (89%).
Enterprises are the largest client group, at 34%. Of the 448 with a known size, 106 involve small businesses (1 to 50 employees), 93 medium businesses (51 to 200), 97 large businesses (201 to 1,000) and 152 enterprises (more than 1,000). For SEO, enterprises are only 10%.
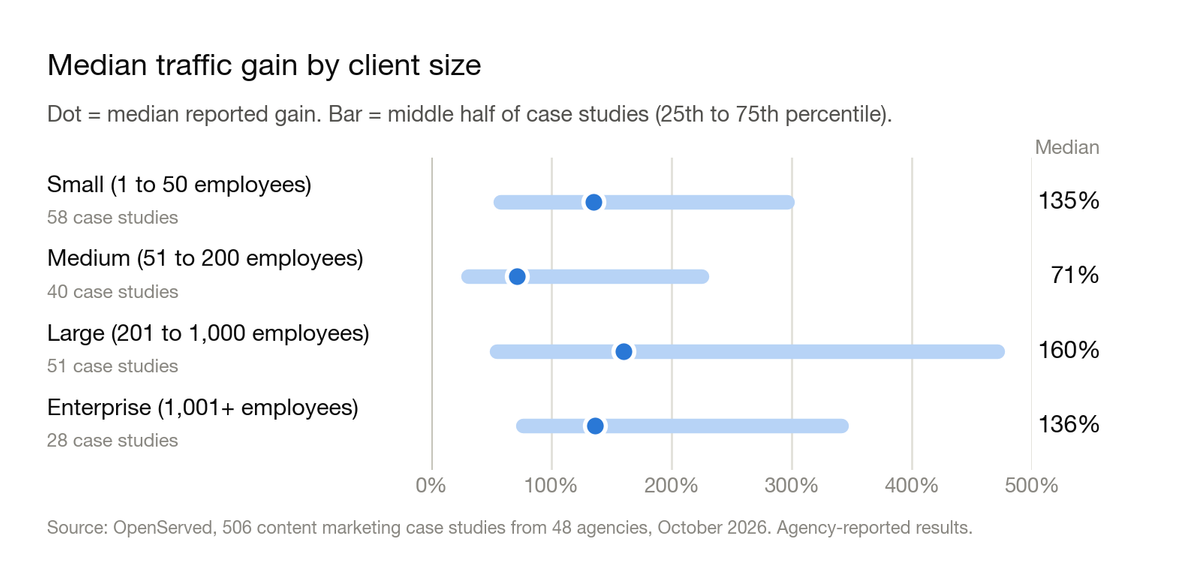
Reported traffic gains don't follow client size. Median reported traffic gain by client size, with the middle half in brackets:
- Small (1 to 50 employees): 135% (57% to 296%), 58 case studies
- Medium (51 to 200): 71% (31% to 225%), 40 case studies
- Large (201 to 1,000): 160% (54% to 471%), 51 case studies
- Enterprise (1,000+): 136% (76% to 341%), 28 case studies
Small businesses report a median 76% gain in conversions or leads. 25 small-business case studies state one, with the middle half between 43% and 155%. Other sizes have too few data points to report.
The bigger the client, the less the case study talks about traffic. A traffic stat appears in 68% of small-business case studies and 34% of enterprise ones. A keyword ranking stat appears in 37% of small-business case studies and 14% of enterprise ones.
Enterprise case studies report reach. An engagement, reach or awareness stat appears in 55% of enterprise case studies, against 13% of small-business ones. A revenue, lead or conversion stat appears in 24% of enterprise case studies, against 46% of small-business ones.
Small businesses buy content with SEO; enterprises buy it without. SEO is listed alongside in 67% of small-business case studies, 48% of medium, 39% of large and 25% of enterprise ones.
Content marketing statistics by country
Country is the client's location, not the agency's. It is recorded for 469 of the 506 case studies (93%).
82% of content marketing case studies are for US clients. 383 of the 469 located case studies are in the United States. The other 86 are spread across 24 countries and territories, led by the United Kingdom (22), Canada (9) and Australia (8).
US clients report a median 107% increase in traffic. 171 US case studies state one, with the middle half between 52% and 306%. The median gain in conversions or leads is 100% (64 case studies) and the median revenue gain is 64% (41 case studies).
International clients report a median 200% increase in traffic. That rests on exactly 20 case studies, with the middle half between 68% and 372%, so treat it as a first reading. No single country has enough data for its own benchmark.
California accounts for 24% of US content marketing case studies. 92 of the 383 are for California clients, followed by Texas (46) and New York (45). The median reported traffic gain is 106% for California (38 case studies) and 101% for Texas (23).
How long content marketing takes: what the data can't tell you
Only 1 of the 506 case studies says how long the work took. Content marketing is widely described as a slow channel, but this dataset can't measure how slow, so we don't try.
Only 24% mention any time period at all. 123 case studies include a time reference somewhere in their result stats, such as "year over year" or "in 12 months". The other 76% give a result with no window.
If you're comparing agencies, ask for the timeframe behind every number. A doubling of blog traffic in six months is a different result from the same doubling over three years.
The agencies behind the data
Three agencies publish 32% of the content marketing case studies. Siege Media has 63, Brafton 51 and Big Leap 48. Half the agencies have six or fewer.
The traffic number is lower without the largest publisher. Siege Media supplies 43 of the 211 traffic data points; without it, the median traffic gain is 100%, against 118% with it. The keyword, lead and revenue figures don't depend on it.
How much of this data is verified?
Only 2% of content marketing case studies are Client-verified. 11 of the 506 carry OpenServed's Client-verified badge, meaning the named client confirmed the results. The other 98% are agency-reported.
There isn't enough verified data yet to compare the two. No metric has 10 verified data points. We'll report the comparison once the verified group is large enough.
Keep this in mind with every number on this page. A published case study is an agency's best work, described in the agency's words. Without a client confirming it, it's a claim, not a benchmark.
What this means if you're hiring a content marketing agency
- Treat a doubling of traffic as the typical published win, not a promise. The median case study reports 118%, and case studies are the programs that went well.
- Ask for leads or revenue, not only traffic. Only 37% of content marketing case studies report a business outcome.
- Decide which kind of content marketing you're buying. Content sold with SEO is measured in traffic and rankings. Content sold without it is measured in reach and awareness. Make sure the agency's proof matches the result you need.
- Ask what was produced. Only 12% of case studies say how much content the result took.
- Be careful with keyword percentages. The median reported keyword gain is 224% because keyword counts start small.
- Ask for the timeframe. Only 1 case study in 506 states one.
- Ask whether the client confirmed it. Only 2% of content marketing case studies are Client-verified.
You can browse every case study behind these numbers in OpenServed's content marketing agency directory, and filter by industry, client size and location.
Methodology
- Source: all 506 case studies in OpenServed's directory that list Content Marketing as a service, as of October 5, 2026, from 48 agencies. Each links to the agency's own published case study.
- Result stats: each case study carries the result stats the agency published, as free text. We assigned each stat to a metric by keyword matching: traffic, keyword rankings, leads, conversions, revenue, conversion rate, impressions, social engagement and reach, backlinks, PR or earned media, and content produced.
- Percentages only: medians use stats that state a percentage change. Plain counts, dollar figures and before-and-after pairs are left out, though they still count toward what case studies report.
- Other channels excluded: stats that name paid media, ads, cost per acquisition, ROAS, email or Amazon are not counted as content marketing results. That removes 6% of all stats. Organic, SEO, social and PR stats are kept.
- Organic and blog traffic: a traffic stat counts as organic when it names organic, search or blog traffic.
- One data point per case study: if a case study has several stats for the same metric, we use the first one listed. Conversions and leads are combined, using whichever comes first.
- Median and middle half: we report the median, not the average, because a handful of gains above 1,000% would distort an average. The middle half is the range from the 25th to the 75th percentile.
- Minimum sample: we report a segment only when it has at least 20 data points for that metric.
- Bundled services: 92% of these case studies list other services alongside Content Marketing, most often SEO. Results can't be attributed to content alone.
- Industry groups: we merged 101 industry labels into 13 groups for the roll-up figures. Client size uses employee count: small is 1 to 50, medium 51 to 200, large 201 to 1,000 and enterprise more than 1,000.
- Selection bias: agencies publish their wins, and the directory is not a random sample of the industry. Three agencies account for 32% of these case studies.
- Agency-reported: except for the 11 Client-verified case studies, results are as published by each agency and haven't been independently confirmed.
Cite this data: OpenServed, "Content Marketing Statistics 2026: Results From 500+ Agency Case Studies", October 2026, https://openserved.com/blog/content-marketing-statistics
FAQs
How many content marketing case studies did you analyze?
506 case studies from 48 agencies, as of October 2026. Each one lists Content Marketing as a service and links to the agency's own published case study.
What is a good result from content marketing?
The median case study reports a 118% increase in website traffic, and half fall between 53% and 314%. These are published wins, so a typical program is likely to land lower.
How much can content marketing increase leads and revenue?
Among case studies that state a percentage, the median reported increase is 88% for conversions or leads and 88% for revenue. Only 37% of content marketing case studies report a lead, conversion or revenue result at all.
Does content marketing work better with SEO?
The two are measured differently. Case studies that pair content with SEO report traffic and rankings, with a median revenue gain of 112%. Those without SEO lean toward enterprise brands and report reach more often, with a median revenue gain of 58%.
Which industries use content marketing most?
Software and technology companies, at 21% of case studies, followed by retail and ecommerce at 15%. Retail and ecommerce clients report the highest median traffic gain, at 178%.
Is content marketing worth it for small businesses?
Small businesses with 1 to 50 employees are 24% of case studies with a known size. They report a median 135% increase in traffic and a 76% gain in conversions or leads.
How long does content marketing take to work?
This dataset can't answer that. Only 1 of the 506 case studies says how long the engagement ran, and only 24% mention any time period in their results.
Are these results verified?
Mostly not. Only 2% of content marketing case studies carry the Client-verified badge. The rest are reported by the agency and haven't been confirmed by the client.