
Content Marketing vs PPC: Results From 3,600+ Agency Case Studies
16 min readLast updated November 3, 2026
On this page
- Content marketing vs PPC at a glance
- The short answer
- What content marketing and PPC case studies report
- Content marketing vs PPC results on shared metrics
- What each channel measures on its own
- Content marketing vs PPC by industry
- Content marketing vs PPC by client size
- What happens when content marketing and PPC are combined
- What the data can't tell you
- Content marketing or PPC: which should you choose?
- Methodology
- FAQs
Content marketing and PPC are the two ends of the "earn it or buy it" choice. Content builds an audience over time; PPC buys clicks today and stops when the budget stops. Most comparisons stop at how the two work. Very few show what each one delivered for real clients.
This page compares them with data. It draws on 3,623 case studies from 288 marketing agencies in OpenServed's directory: 1,653 that list content marketing, 2,137 that list PPC, and 167 that list both. For the head-to-head we use the 1,486 case studies that list content marketing without PPC and the 1,970 that list PPC without content marketing. We don't use single-service case studies here, as some of our other comparisons do, because the 310 that list content marketing alone include too few numbers to compare.
Data as of November 2026. These are results agencies chose to publish, so they show what a successful campaign looks like, not what an average one does. If you cite a number, please cite the date.
Content marketing vs PPC at a glance
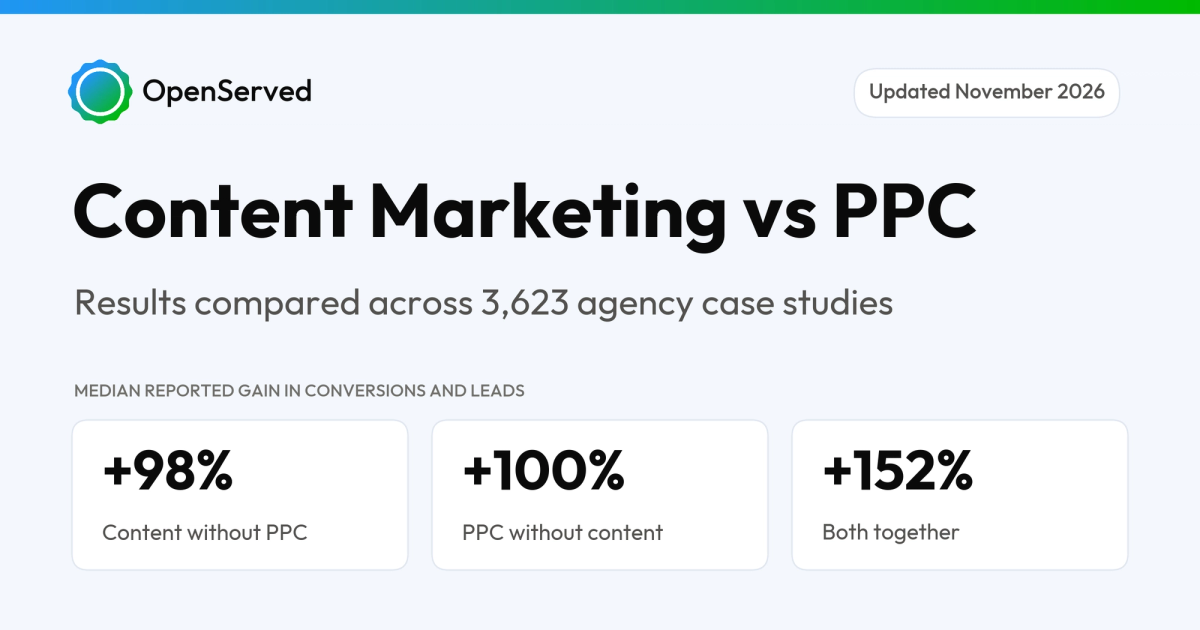
- On conversions and leads, the two are level: a median 98% increase for content marketing case studies and 100% for PPC ones.
- PPC leads on revenue: a median 100% increase against 83% for content marketing.
- Content marketing leads on traffic: a median 122% increase in website traffic against 101% for PPC.
- PPC case studies are far more likely to prove a business result. 66% report revenue, leads or conversions, against 29% of content marketing case studies.
- Only PPC case studies show what a result cost. 26% of PPC case studies report a cut in cost per acquisition or lead, and 14% report ROAS. Under 1% of content marketing case studies report either.
- Content marketing case studies report reach. 21% include social engagement or reach, against 4% of PPC case studies.
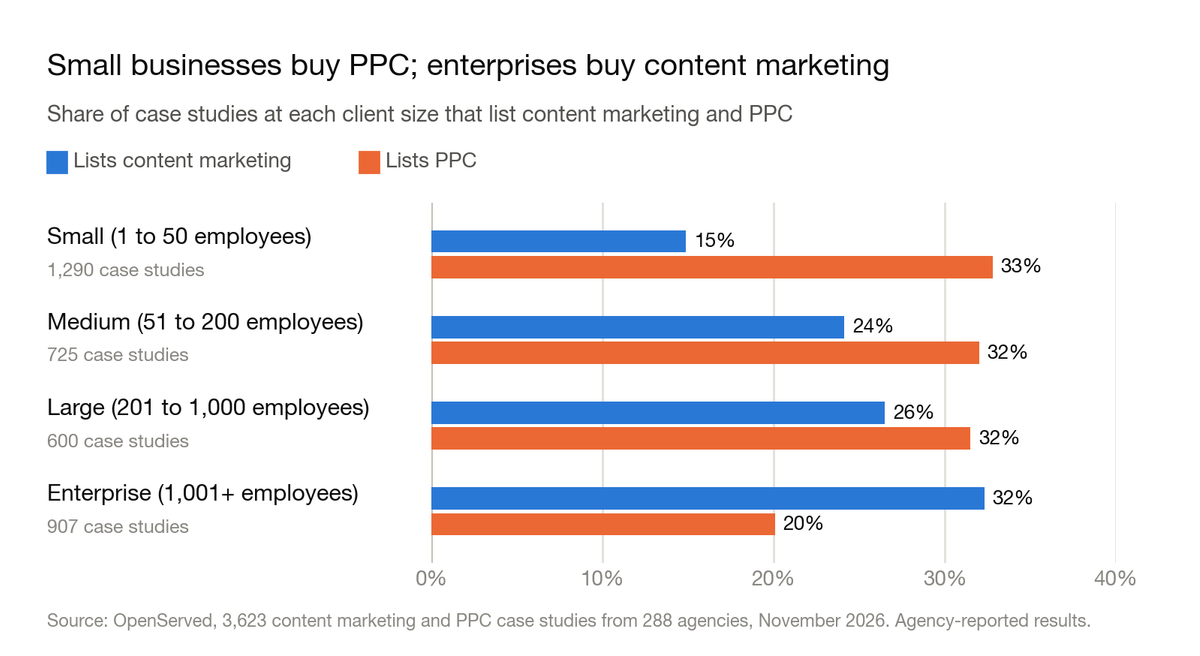
- Small businesses buy PPC; enterprises buy content marketing. PPC appears in 33% of small-business case studies and content marketing in 15%. Among enterprises it is 20% and 32%.
- Few case studies combine the two. Only 167 list both, and they report the largest lead gains, a median 152%, on 42 data points.
- The data can't measure ROI or speed. Only 3 of the 3,623 case studies state a budget, and only 15 say how long the work took.
The short answer
Neither channel wins outright. On leads they are level. PPC case studies report larger revenue gains, are more than twice as likely to show a business result, and are the only ones that show what a customer cost. Content marketing case studies report larger traffic gains and are the only ones that report reach, and they come mostly from large companies. If you need sales you can measure, PPC has the stronger record. If you need an audience or attention, content marketing is the more common choice. The last section of this page turns that into a choice.
What content marketing and PPC case studies report
Before comparing results, look at what each channel's case studies choose to show. The two are sold and proven in different ways.
Content marketing case studies report traffic and reach; PPC case studies report sales and cost. Share of case studies that include each result:
- Website traffic: 32% of content marketing, 17% of PPC
- Keyword rankings: 18% of content marketing, 4% of PPC
- Conversions or leads: 19% of content marketing, 42% of PPC
- Revenue or sales: 12% of content marketing, 29% of PPC
- Cost per acquisition or lead: under 1% of content marketing, 26% of PPC
- ROAS: none of content marketing, 14% of PPC
- Social engagement and reach: 21% of content marketing, 4% of PPC
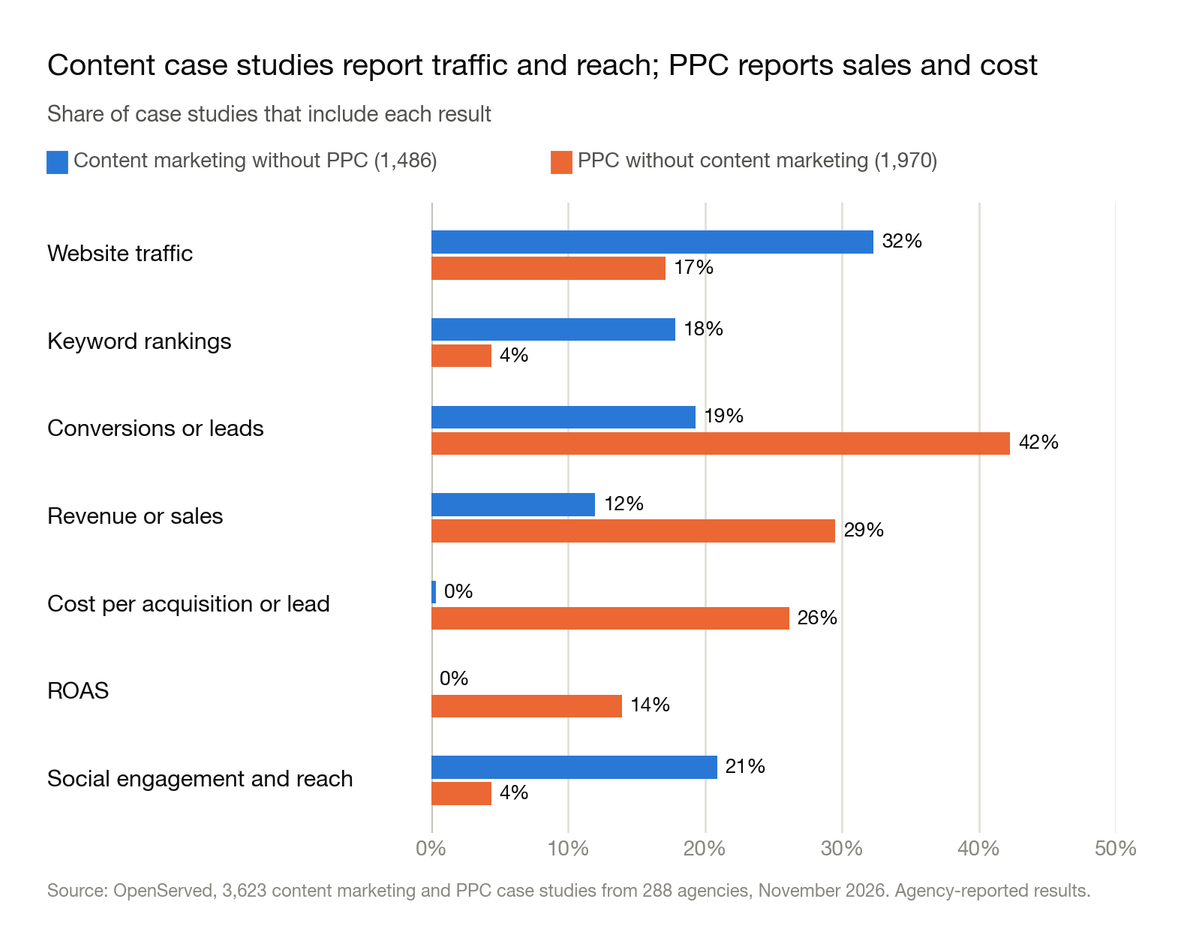
PPC case studies are more than twice as likely to show a business result. 66% of PPC case studies report revenue, leads or conversions. For content marketing case studies it is 29%.
Cost is almost never part of a content marketing case study. 45% of PPC case studies report an efficiency metric such as cost per acquisition, cost per click or ROAS. Only 2% of content marketing case studies do.
Content marketing case studies are more likely to have no number at all. 15% of them report no figure of any kind, against 4% of PPC case studies.
Content marketing vs PPC results on shared metrics
Traffic, leads, revenue and conversion rate mean the same thing for both channels, so they can be compared directly. Content marketing traffic is mostly organic; PPC traffic is mostly paid.
The two are level on leads; content marketing is ahead on traffic and PPC on revenue. Median reported gain, with the middle half in brackets:
- Website traffic: 122% for content marketing (57% to 362%, 354 case studies), 101% for PPC (51% to 250%, 255 case studies)
- Conversions or leads: 98% for content marketing (52% to 216%, 147 case studies), 100% for PPC (48% to 266%, 561 case studies)
- Revenue: 83% for content marketing (31% to 208%, 101 case studies), 100% for PPC (47% to 252%, 424 case studies)
- Conversion rate: 62% for content marketing (14% to 152%, 27 case studies), 66% for PPC (30% to 162%, 246 case studies)
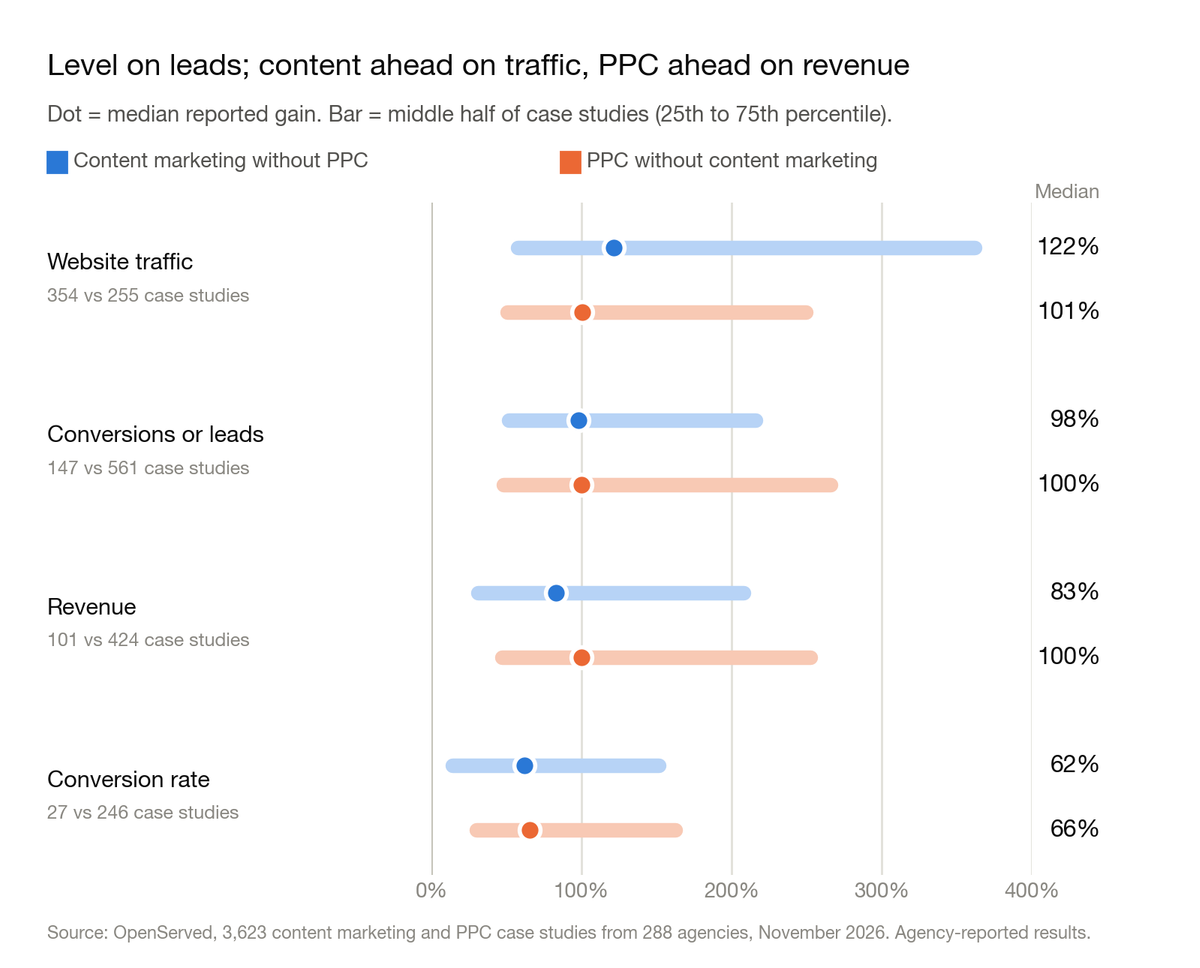
Leads and conversions separately. The median reported gain in leads is 87% for content marketing and 100% for PPC (111 and 302 case studies). For conversions it is 164% and 100% (42 and 274 case studies).
The same share report doubled results. 49% of content marketing case studies that report a gain in conversions or leads say it at least doubled, against 51% for PPC.
The pattern holds without the largest publisher on each side, though the traffic gap narrows. Without Siege Media, which supplies 4% of the content marketing case studies, the median content marketing gain is 109% in traffic, 98% in conversions or leads and 83% in revenue. Without Coalition Technologies, 9% of the PPC case studies, the PPC figures are 103%, 100% and 98%.
This is not proof that PPC produces more revenue than content marketing. Two things sit behind the gap:
- Different clients. 37% of content marketing clients with a known size are enterprises, against 17% of PPC clients. Across the directory, enterprises report smaller revenue gains than smaller companies do.
- Different goals. Content marketing is often bought for reach and awareness, not sales. Its case studies report revenue less than half as often as PPC ones.
What each channel measures on its own
Some results exist for one channel only. They are shown side by side here, not as a contest. These figures come from all case studies that list each channel, and each links to its full breakdown.
Content marketing (Content Marketing Statistics 2026):
- Organic and blog traffic: median reported increase of 130% (265 case studies)
- Keyword rankings: median reported growth of 151% (98 case studies)
- Engagement, reach or impressions: median reported gain of 138% (172 case studies)
PPC (PPC Statistics 2026):
- Cost per acquisition or lead: median reported cut of 42% (389 case studies)
- ROAS: median reported increase of 80% (124 case studies)
- Click-through rate: median reported increase of 78% (108 case studies)
- Cost per click: median reported cut of 38% (86 case studies)
Content marketing vs PPC by industry
This section uses every case study that lists each channel, so a case study listing both counts on both sides. We merged industry labels into 13 groups (see methodology).
Content marketing leads in software, education and B2B services; PPC leads in consumer and local businesses. Share of each industry's case studies that list content marketing and PPC:
- Education & Nonprofit: 31% content marketing, 23% PPC
- Software & Technology: 29% content marketing, 21% PPC
- Professional & B2B Services: 25% content marketing, 20% PPC
- Financial Services: 23% content marketing, 21% PPC
- Food & Beverage: 21% content marketing, 20% PPC
- Industrial & Manufacturing: 21% content marketing, 26% PPC
- Healthcare & Wellness: 21% content marketing, 33% PPC
- Home, Property & Local Services: 19% content marketing, 33% PPC
- Retail & Ecommerce: 17% content marketing, 31% PPC
- Fashion, Beauty & Jewelry: 11% content marketing, 37% PPC
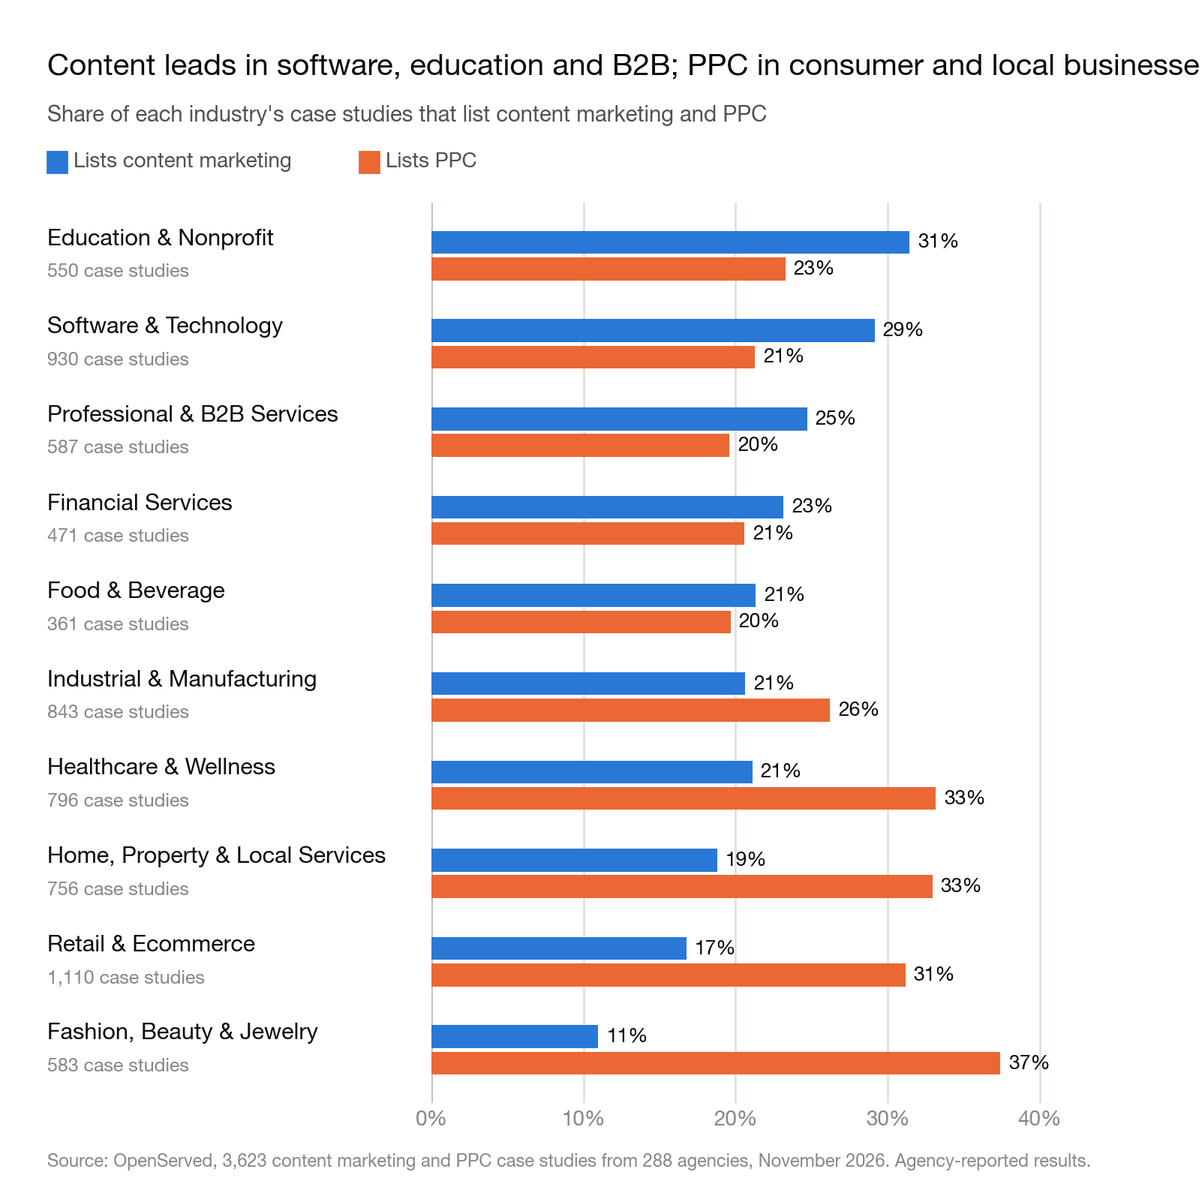
Fashion brands use PPC more than three times as often as content marketing, at 37% against 11%. Retail and home services use it almost twice as often.
Lead gains split by industry. Median reported gain in conversions or leads, for the groups where both channels have at least 20 data points:
- Healthcare & Wellness: 160% for content marketing (31 case studies), 90% for PPC (117)
- Software & Technology: 101% for content marketing (39), 92% for PPC (84)
- Home, Property & Local Services: 109% for content marketing (22), 115% for PPC (75)
- Industrial & Manufacturing: 83% for content marketing (31), 146% for PPC (68)
Healthcare is where content marketing does best; manufacturing is where PPC does. Content marketing case studies for healthcare clients report a lead gain nearly twice as large as PPC ones. For manufacturers, PPC's is nearly twice as large.
For consumer brands, PPC reports bigger revenue gains. The median reported revenue gain for Retail & Ecommerce clients is 103% for PPC (169 case studies) and 83% for content marketing (48). For Fashion, Beauty & Jewelry it is 107% for PPC (104) and 92% for content marketing (20).
Content marketing reports bigger traffic gains in three of the four industries we can compare. The median reported traffic gain is 165% for content marketing and 125% for PPC in Healthcare & Wellness (49 and 33 case studies), 154% and 95% in Retail & Ecommerce (50 and 36), and 130% and 108% in Software & Technology (69 and 29). Home services are the exception, at 113% for content marketing and 171% for PPC (39 and 30).
Content marketing vs PPC by client size
This section also uses every case study that lists each channel. Client size is the client's employee count, recorded for 50% of content marketing case studies and 48% of PPC ones.
The bigger the client, the more likely it is to buy content marketing. Share of case studies at each client size that list content marketing and PPC:
- Small (1 to 50 employees): 15% content marketing, 33% PPC
- Medium (51 to 200): 24% content marketing, 32% PPC
- Large (201 to 1,000): 26% content marketing, 32% PPC
- Enterprise (more than 1,000): 32% content marketing, 20% PPC
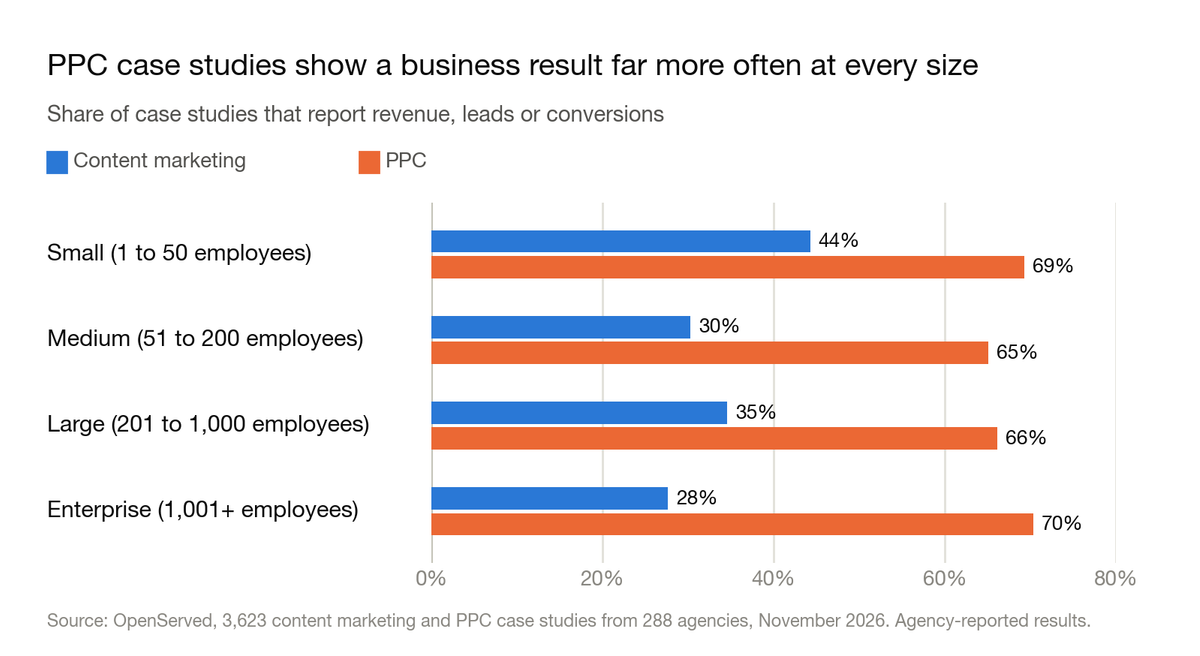
PPC case studies show a business result far more often at every size. Share of case studies that report revenue, leads or conversions:
- Small: 44% for content marketing, 69% for PPC
- Medium: 30% for content marketing, 65% for PPC
- Large: 35% for content marketing, 66% for PPC
- Enterprise: 28% for content marketing, 70% for PPC
PPC reports bigger lead gains at three of the four sizes. The median reported gain in conversions or leads is 79% for content marketing and 109% for PPC among small businesses (40 and 119 case studies), 72% and 81% among large businesses (26 and 71), and 65% and 73% among enterprises (25 and 63). Medium businesses are the exception, at 168% for content marketing and 107% for PPC (20 and 82).
PPC reports bigger revenue gains for small businesses and enterprises. The median is 73% for content marketing and 92% for PPC among small businesses (20 and 106 case studies), and 36% and 74% among enterprises (21 and 35).
Enterprises use content marketing for reach. An engagement, reach or awareness result appears in 46% of enterprise content marketing case studies, against 17% of enterprise PPC ones.
What happens when content marketing and PPC are combined
Few case studies combine these two. Only 167 list both content marketing and PPC. That is 10% of all content marketing case studies and 8% of all PPC ones, and 39% of the 167 also list SEO.
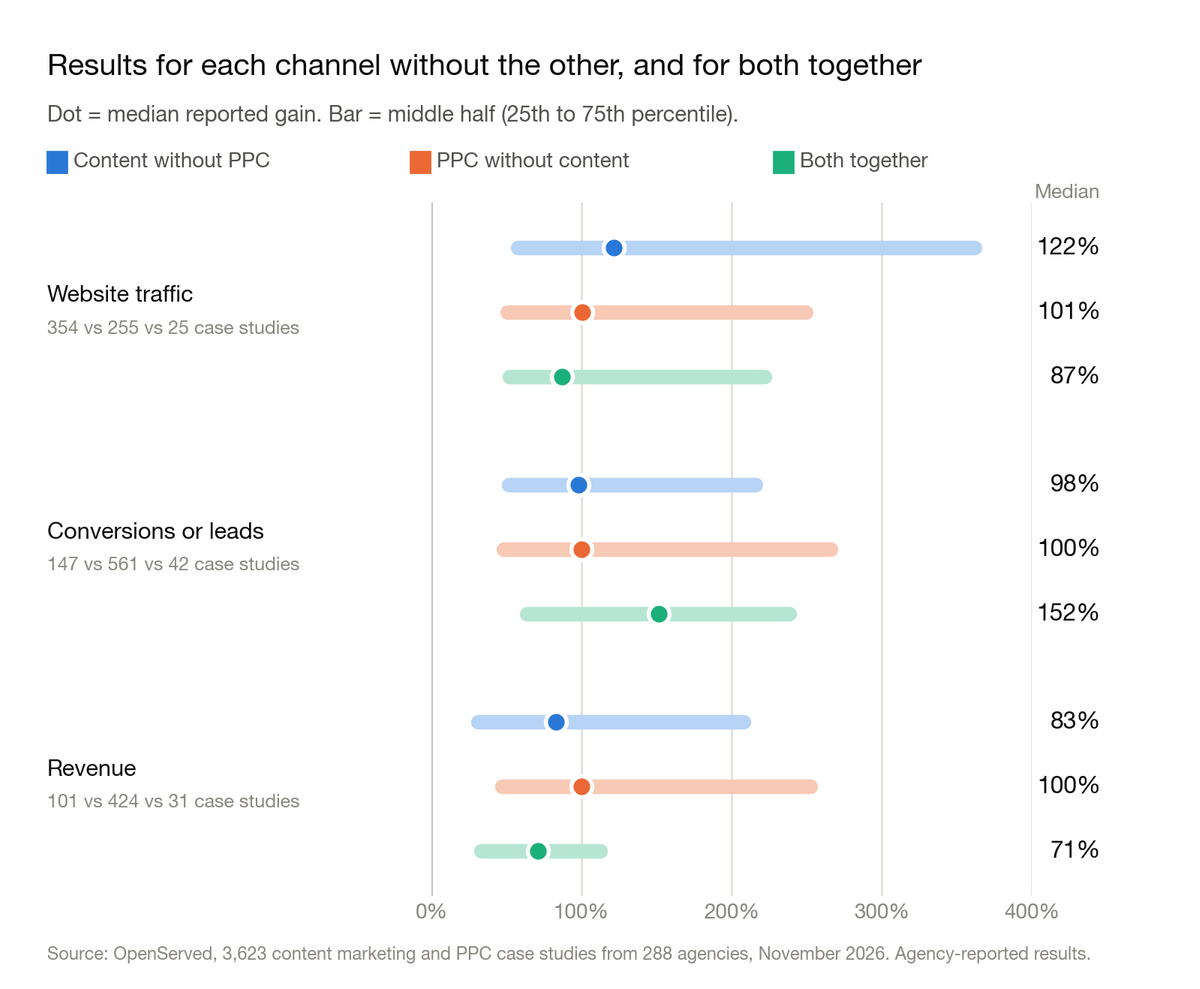
Combined case studies report the largest lead gains, but the smallest revenue and traffic gains. Median reported gain, with the middle half in brackets:
- Conversions or leads: 152% together (63% to 238%, 42 case studies), 98% for content marketing, 100% for PPC
- Revenue: 71% together (33% to 112%, 31 case studies), 83% for content marketing, 100% for PPC
- Website traffic: 87% together (52% to 222%, 25 case studies), 122% for content marketing, 101% for PPC
Combined case studies are almost as likely as PPC to show a business result. 63% report revenue, leads or conversions, and 18% report a cut in acquisition cost.
These figures rest on 25 to 42 data points. Read them as what agencies report from a multi-channel program, not as proof that the two channels multiply each other.
What the data can't tell you
It can't measure ROI. Only 3 of the 3,623 case studies state a budget. Without spend, there is no way to compare what each channel returned per dollar.
It can't measure speed. Only 15 case studies say how long the work took. A time period of any kind appears in the results of 19% of content marketing case studies and 23% of PPC ones.
It only shows wins. Agencies publish their best work, and only 310 of the 3,623 case studies (8.6%) are Client-verified. Every number here is a published best case, not a typical outcome.
General context, not from this data: PPC can start producing clicks the day a campaign goes live, and stops when the spend stops. Content usually takes months to build an audience, and what it earns can keep working after the work ends. Those differences matter for the choice below, but our case studies can't put a number on them.
Content marketing or PPC: which should you choose?
The data doesn't pick a winner, but it does show where each channel has the stronger record.
- If you need sales you can measure, PPC has the proof. 66% of PPC case studies report a business result and 26% report what a customer cost. Content marketing case studies rarely show either.
- If you're a small business, PPC is the more common choice. PPC is listed in 33% of small-business case studies and content marketing in 15%. Small businesses report a median lead gain of 109% from PPC and 79% from content marketing.
- If you sell online or run a local service business, most of the evidence is for PPC. Fashion, retail and home services use PPC between almost twice and more than three times as often as content marketing, and retail and fashion clients report bigger revenue gains from it.
- If you're in healthcare, look hard at content marketing. Content marketing case studies for healthcare clients report a median lead gain of 160%, against 90% for PPC.
- If you're in software, education or B2B services, content marketing is the more common choice. It appears more often than PPC in all three.
- If you're a large company that needs reach and attention, content marketing is the usual tool. It appears in 32% of enterprise case studies, against 20% for PPC, and almost half of those report engagement, reach or awareness.
- If you need results quickly, PPC is the usual answer. That comes from how the channels work, not from this data.
Whichever you choose, ask an agency for three things most case studies leave out: a business result, what it cost, and how long it took.
You can browse the case studies behind these numbers in OpenServed's content marketing agency directory and PPC agency directory, and filter by industry, client size and location. For related comparisons, see SEO vs Content Marketing, Content Marketing vs Social Media Ads, SEO vs PPC and PPC vs Social Media Ads.
Methodology
- Source: all 3,623 case studies in OpenServed's directory that list Content Marketing, PPC or both, as of November 2, 2026, from 288 agencies: 1,653 list Content Marketing, 2,137 list PPC and 167 list both. Each links to the agency's own published case study.
- Head-to-head groups: the comparison uses the 1,486 case studies that list Content Marketing but not PPC, and the 1,970 that list PPC but not Content Marketing. Each may list other services too. We didn't use single-service case studies because the 310 that list Content Marketing alone include too few results: 31 traffic results and 10 lead or conversion results.
- All case studies: the industry and client-size sections use every case study that lists each channel. A case study that lists both counts toward both.
- One set of metric rules: each case study carries the result stats the agency published, as free text. We assigned each stat to a metric by keyword matching, using the same rules for both channels.
- Other channels excluded: each side leaves out stats that name another channel, using the same rules as our statistics pages. Content marketing results leave out stats that name paid media, ads, cost per acquisition, ROAS, email or Amazon. PPC results leave out stats that name organic search, SEO, social media, email, Amazon or PR. Case studies that list both leave out stats that name a third channel.
- Percentages only: medians use stats that state a percentage change. Plain counts, dollar figures and before-and-after pairs are left out, though they still count toward what case studies report.
- Direction: cost metrics count reductions; every other metric counts increases. Comparisons with a goal, target or industry average are left out.
- One data point per case study: if a case study has several stats for the same metric, we use the first one listed. "Conversions or leads" uses whichever comes first.
- Median and middle half: we report the median, not the average, because a handful of gains above 1,000% would distort an average. The middle half is the range from the 25th to the 75th percentile.
- Minimum sample: we compare the two channels on a metric or segment only when both have at least 20 data points.
- Channel-specific figures: the figures under "What each channel measures on its own" are quoted from our content marketing and PPC statistics pages.
- Industry groups: we merged industry labels into 13 groups. Client size uses employee count: small is 1 to 50, medium 51 to 200, large 201 to 1,000 and enterprise more than 1,000.
- Missing details: client size is recorded for 49% of the content marketing case studies and 48% of the PPC case studies in the head-to-head, so size figures cover only the case studies that have it.
- Selection bias: agencies publish their wins, and the directory is not a random sample of the industry. Coalition Technologies supplies 9% of the PPC case studies without content marketing.
- Agency-reported: except for the 310 Client-verified case studies, results are as published by each agency and haven't been independently confirmed.
Cite this data: OpenServed, "Content Marketing vs PPC: Results From 3,600+ Agency Case Studies", November 2026, https://openserved.com/blog/content-marketing-vs-ppc
FAQs
Is content marketing or PPC better?
Neither wins outright. On conversions and leads they are level (98% vs 100%). PPC case studies report larger revenue gains (100% vs 83%) and are far more likely to show a business result. Content marketing case studies report larger traffic gains (122% vs 101%).
Which has better ROI, content marketing or PPC?
This data can't say. Only 3 of 3,623 case studies state a budget, so return per dollar can't be calculated for either channel. Be wary of any source that claims a precise ROI comparison without spend data.
Is content marketing or PPC better for small businesses?
Small businesses use PPC more often: it appears in 33% of small-business case studies, against 15% for content marketing. They report a median lead gain of 109% from PPC and 79% from content marketing.
Is content marketing or PPC better for ecommerce?
For retail and ecommerce clients, PPC case studies report a larger median revenue gain, 103% against 83% for content marketing. Content marketing case studies report a larger traffic gain, 154% against 95%.
Is content marketing or PPC better for B2B?
Software and B2B services firms use content marketing more often than PPC. Results are mixed: content marketing reports slightly bigger lead gains in software, and PPC reports much bigger lead gains in manufacturing.
Should I do content marketing and PPC together?
Few case studies combine the two. Those that do report the largest lead gains, a median 152%, but smaller revenue and traffic gains than either channel alone, on 25 to 42 data points.
Which is faster, content marketing or PPC?
PPC is generally faster to start, because ads can run as soon as a campaign is live. This dataset can't measure it: only 15 of 3,623 case studies say how long the work took.