
SEO Statistics 2026: Results From 1,000+ Agency Case Studies
15 min readLast updated October 9, 2026
On this page
- SEO statistics at a glance
- What SEO case studies report
- Organic traffic statistics
- Keyword ranking statistics
- SEO lead and conversion statistics
- SEO revenue statistics
- SEO statistics by industry
- SEO statistics by client size
- SEO statistics by country
- How long SEO takes: what the data can't tell you
- How SEO is sold: bundles and agencies
- How much of this data is verified?
- What this means if you're hiring an SEO agency
- Methodology
- FAQs
Most SEO statistics pages recycle the same survey numbers: what share of clicks go to the first result, how many marketers say SEO is their top channel. Very few tell you what an SEO campaign actually produced for a real client.
This page does. Every number below is counted from 1,090 SEO case studies published by 59 marketing agencies, all indexed in OpenServed's directory. Each case study names a client and states the results the agency reported: traffic, rankings, leads, conversions and revenue.
Data as of October 2026. These are results agencies chose to publish, so they show what a successful SEO campaign looks like, not what an average one does. The directory keeps growing, so if you cite a number, please cite the date.
SEO statistics at a glance
- 1,090 SEO case studies from 59 agencies, covering 128 industries and clients in 26 countries and territories.
- 102% is the median reported increase in organic traffic. Half of the 462 case studies that state one fall between 43% and 254%.
- 51% of those case studies report that organic traffic at least doubled. 29% report a gain under 50%.
- 227% is the median reported growth in keyword rankings, across 173 case studies.
- 102% is the median reported increase in leads (134 case studies) and 120% in conversions (98 case studies).
- 110% is the median reported increase in revenue across 219 case studies, most of them for retail, ecommerce and fashion brands.
- Industrial and manufacturing clients report the highest median organic traffic gain at 138%. Education and nonprofit clients report the lowest, at 73%.
- Small businesses report a median organic traffic gain of 110%. Mid-sized companies report 68%.
- Only 28% of SEO case studies are about SEO alone. The rest bundle it with PPC, content marketing or web design.
- Only 3.5% are Client-verified, and fewer than 1% say how long the work took.
What SEO case studies report
Traffic is the result agencies report most. 61% of SEO case studies include a traffic stat, and 45% specify organic traffic. Keyword rankings appear in 31%, revenue or sales in 23%, leads in 15%, conversions in 11% and conversion rate in 7%. Backlinks appear in just 5.5%.
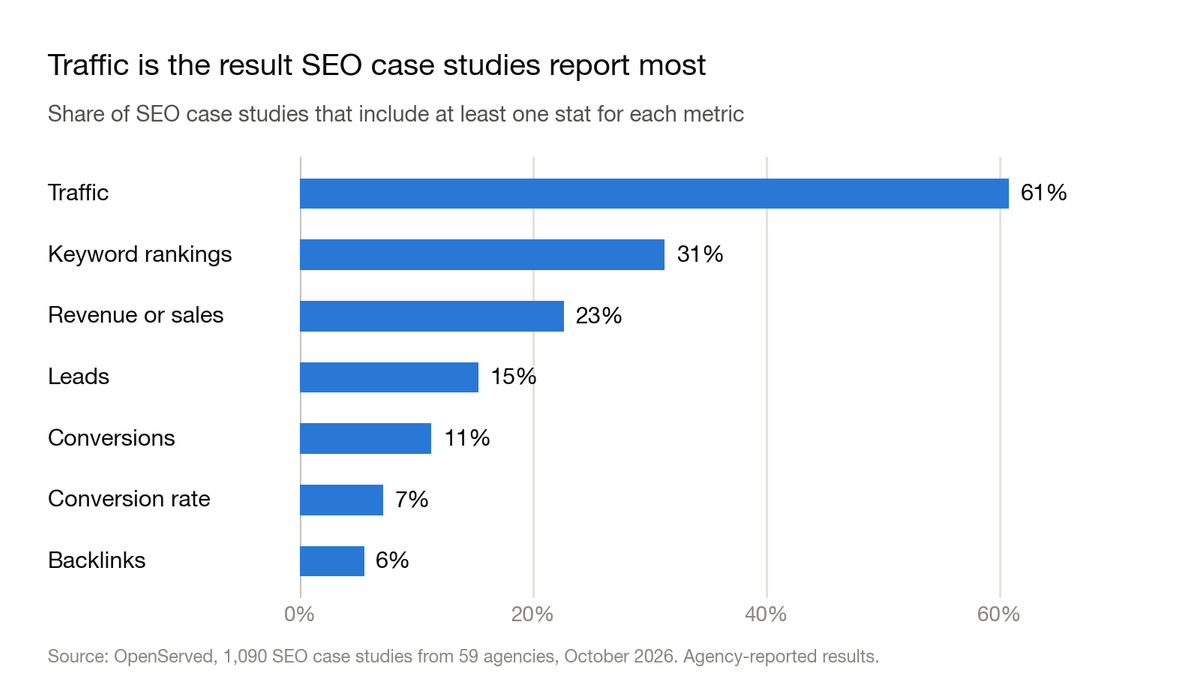
Only 29% of SEO case studies report a lead or conversion result. Agencies are twice as likely to show traffic as to show what that traffic turned into.
76% of result stats are percentages. The 1,090 case studies carry 3,431 result stats, an average of 3.1 each. The medians below use only stats that state a percentage change.
Organic traffic statistics
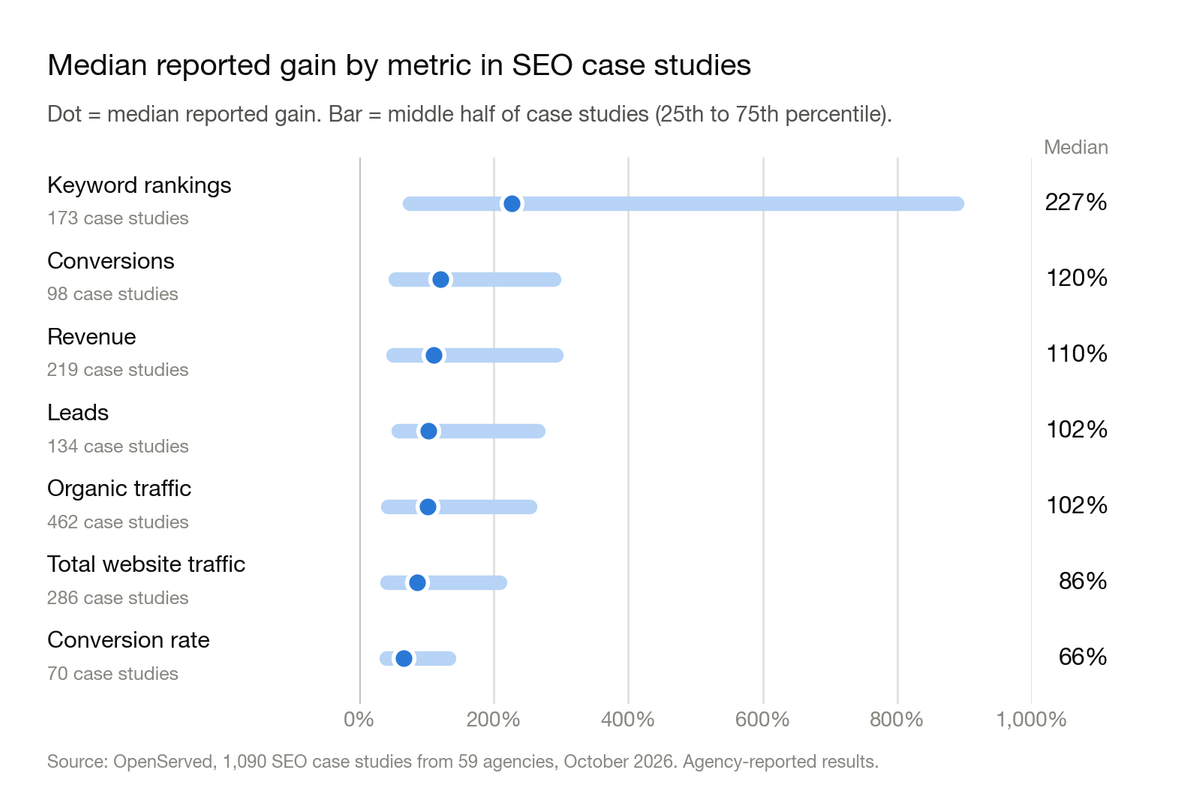
The median SEO case study reports a 102% increase in organic traffic. 462 case studies state a percentage gain in organic traffic, sessions or users. A quarter report 43% or less, and a quarter report 254% or more.
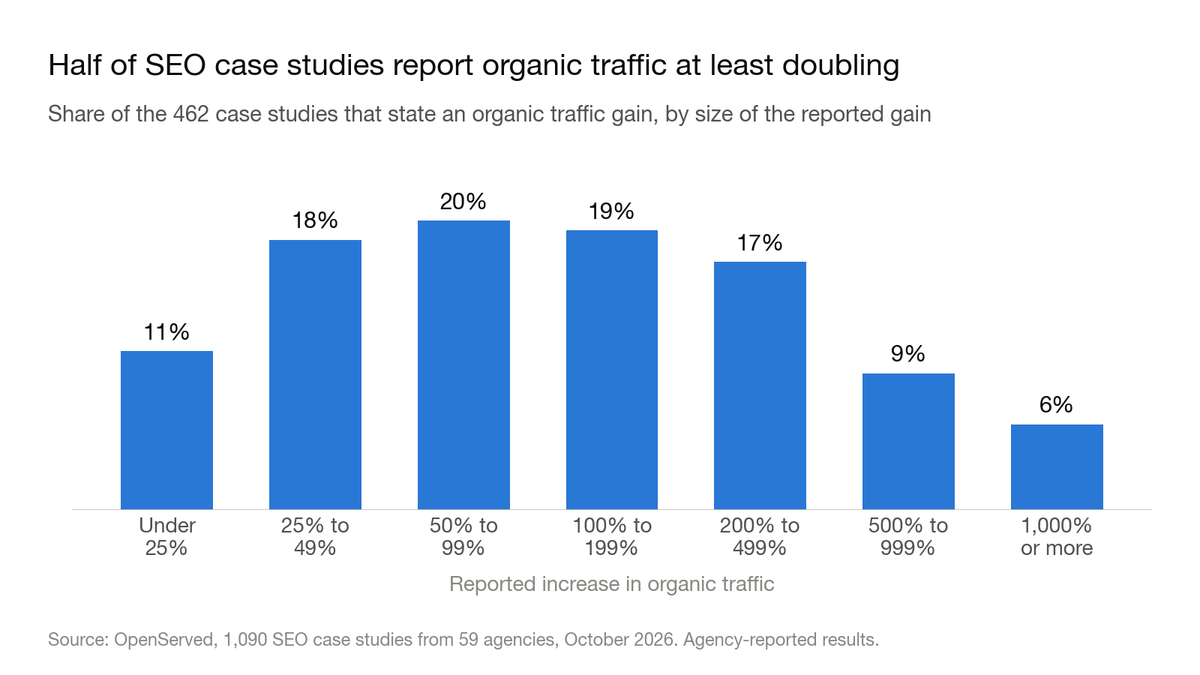
51% report that organic traffic at least doubled. The full spread:
- Under 25%: 11% of case studies
- 25% to 49%: 18%
- 50% to 99%: 20%
- 100% to 199%: 19%
- 200% to 499%: 17%
- 500% to 999%: 9%
- 1,000% or more: 6%
27 case studies claim organic traffic growth of 1,000% or more. The largest claim is 53,400%. Numbers like these come from sites that started with almost no traffic, so read them as a sign of a small starting point, not as a benchmark.
Total website traffic grows less than organic traffic. 286 case studies report a gain in overall traffic without naming the source. Their median is 86%, with the middle half between 41% and 209%.
SEO-only case studies report higher organic traffic gains than bundled ones. Where SEO is the only service listed, the median organic traffic gain is 122% (136 case studies). Where SEO is bundled with other services, it is 96% (326 case studies).
Keyword ranking statistics
The median reported growth in keyword rankings is 227%. 173 case studies state a percentage gain in keywords or rankings. The middle half runs from 75% to 888%, a far wider spread than traffic.
23% of keyword stats claim growth of 1,000% or more. Keyword counts start small, so percentages inflate fast. A site that goes from 5 page-one keywords to 60 has grown 1,100%.
What agencies count changes the number. Agencies measure keywords in three main ways:
- Top 3 positions: median gain of 291% (29 case studies)
- Top 10 or page one: median gain of 274% (64 case studies)
- Total ranking keywords and other measures: median gain of 177% (108 case studies)
More agencies report keywords as a count than as a percentage. 204 case studies give a plain number, such as "120 keywords on page one", which can't be compared across clients.
SEO lead and conversion statistics
The median reported increase in leads is 102%. 134 case studies state a percentage gain in leads, form submissions, calls or bookings. The middle half runs from 58% to 266%.
When the stat says "organic leads", the median drops to 63%. Only 34 case studies tie the lead gain to organic search by name. The other 100 report total leads, which other channels may have helped.
The median reported increase in conversions is 120%. 98 case studies state one, with the middle half between 54% and 289%.
Conversion rate improves less than conversion volume. 70 case studies report a conversion rate gain, with a median of 66% and a middle half of 40% to 133%. Conversions grow through more traffic as well as a better rate, so the volume figure runs higher.
SEO revenue statistics
The median reported increase in revenue is 110%. 219 case studies state a percentage gain in revenue, sales, transactions or orders. The middle half runs from 50% to 292%.
Organic revenue specifically has a median gain of 133%. 100 of the 219 stats name organic revenue or organic transactions. Three-quarters of all revenue stats come from retail, ecommerce, fashion, and food and beverage clients.
SEO statistics by industry
To get enough data points per industry, we rolled 128 industry labels into 13 groups (see methodology). The figures below cover the nine groups with at least 20 case studies that state an organic traffic gain.
Industrial and manufacturing clients report the highest median organic traffic gain, at 138%. Education and nonprofit clients report the lowest, at 73%. Median organic traffic gain by industry group, with the middle half in brackets:
- Industrial & Manufacturing: 138% (41% to 387%), 61 case studies
- Home, Property & Local Services: 137% (49% to 275%), 39 case studies
- Retail & Ecommerce: 122% (49% to 242%), 86 case studies
- Healthcare & Wellness: 111% (49% to 270%), 52 case studies
- Software & Technology: 98% (32% to 251%), 56 case studies
- Professional & B2B Services: 96% (41% to 380%), 32 case studies
- Financial Services: 85% (50% to 298%), 23 case studies
- Fashion, Beauty & Jewelry: 80% (39% to 190%), 40 case studies
- Education & Nonprofit: 73% (41% to 304%), 23 case studies
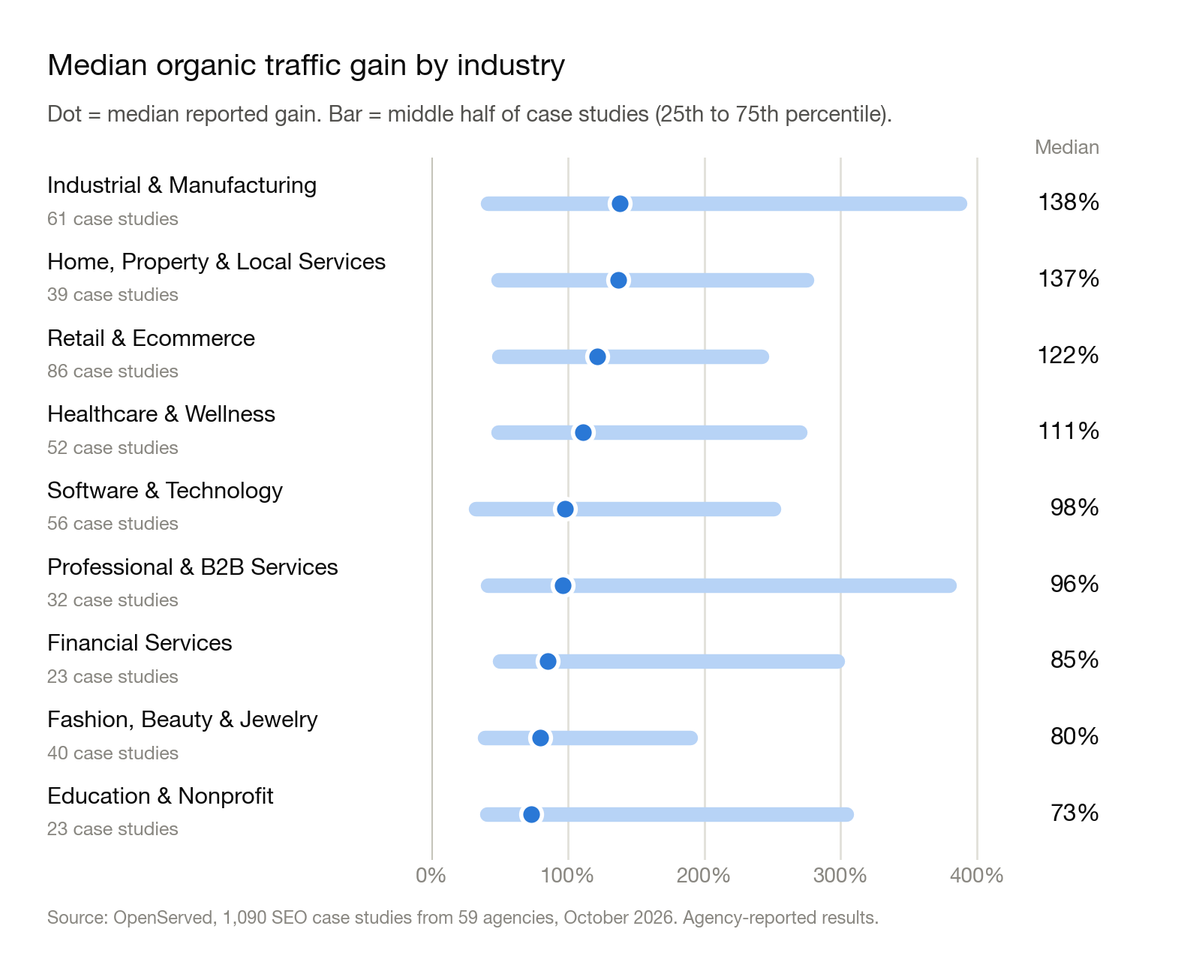
Travel & Hospitality, Automotive, Food & Beverage, and Media & Entertainment each have fewer than 20 data points, so we left them out.
The ranges overlap heavily. Every group's middle half spans at least 150 percentage points. Industry shifts the median, but the gap between a typical and a strong case study inside one industry is far larger than the gap between industries.
SaaS SEO case studies report a median organic traffic gain of 99%. SaaS is the most common single industry in the dataset, with 91 SEO case studies. 42 of them state an organic traffic gain, with the middle half between 32% and 270%.
Fashion SEO case studies report a median organic traffic gain of 69%. 22 of the 64 fashion case studies state one, with the middle half between 40% and 115%. That is the narrowest range of any industry we measured.
Manufacturing SEO case studies report a median organic traffic gain of 106%. 21 of the 51 manufacturing case studies state one, with the middle half between 41% and 236%.
Consumer brands report revenue; B2B and local businesses report leads. A revenue stat appears in 59% of Fashion, Beauty & Jewelry case studies and 45% of Retail & Ecommerce ones, but only 2% of Software & Technology ones. A lead or conversion stat appears in 48% of Home, Property & Local Services case studies and 45% of Professional & B2B Services ones, but only 5% of Fashion, Beauty & Jewelry ones.
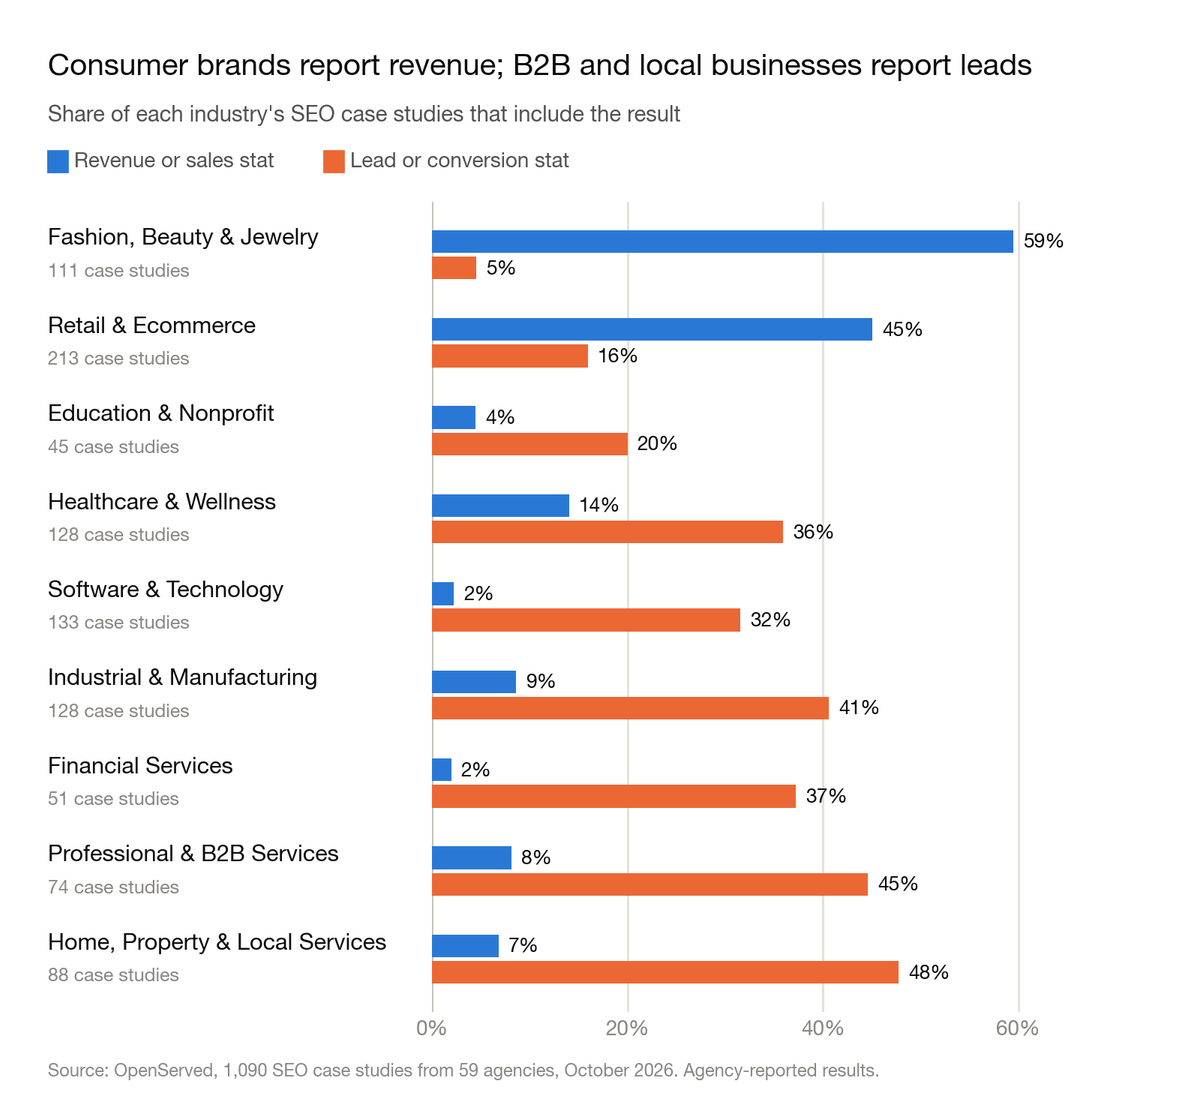
Ecommerce SEO revenue gains have a median of 115%. That figure holds for both Retail & Ecommerce (87 case studies) and Fashion, Beauty & Jewelry (60 case studies).
Lead gains vary more by industry. The median reported increase in leads is 200% for Healthcare & Wellness (22 case studies), 131% for Industrial & Manufacturing (33) and 80% for Home, Property & Local Services (20).
SEO statistics by client size
Client size is the client's employee count. It is recorded for 907 of the 1,090 SEO case studies (83%).
54% of SEO case studies are for small businesses. Of the 907 with a known size, 491 involve small businesses (1 to 50 employees), 184 medium businesses (51 to 200), 141 large businesses (201 to 1,000) and 91 enterprises (more than 1,000).
Small businesses report a median organic traffic gain of 110%. Median organic traffic gain by client size, with the middle half in brackets:
- Small (1 to 50 employees): 110% (44% to 269%), 215 case studies
- Medium (51 to 200): 68% (27% to 168%), 72 case studies
- Large (201 to 1,000): 155% (33% to 320%), 59 case studies
- Enterprise (1,000+): 99% (51% to 358%), 24 case studies
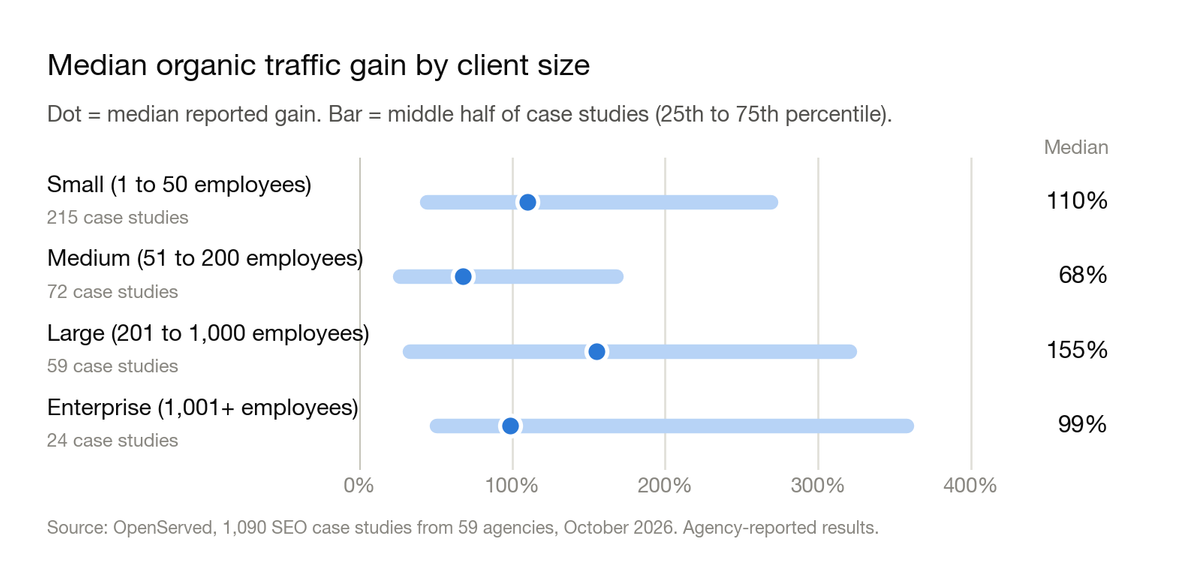
Reported gains don't shrink steadily as clients get bigger. Mid-sized companies report the lowest median, and large companies the highest. The common assumption that bigger sites grow more slowly in percentage terms doesn't show up in published case studies, most likely because agencies only publish their enterprise wins.
Among small businesses, the smallest report slightly more. Companies with 1 to 10 employees have a median organic traffic gain of 117% (81 case studies), against 101% for companies with 11 to 50 employees (134 case studies).
Small-business case studies are more likely to show revenue. A revenue stat appears in 28% of small-business SEO case studies, 20% of medium, 10% of large and 9% of enterprise ones. The share reporting leads or conversions stays between 25% and 33% at every size.
Small businesses are more likely to buy SEO on its own. SEO is the only service in 33% of small-business case studies, against 25% for medium, 18% for large and 21% for enterprise.
Lead gains by size: the median reported increase in leads is 116% for small businesses (49 case studies), 81% for medium (23) and 181% for large (25). Enterprise has too few data points to report.
SEO statistics by country
Country is the client's location, not the agency's. It is recorded for 1,032 of the 1,090 SEO case studies (95%).
90% of SEO case studies are for US clients. 929 of the 1,032 located case studies are in the United States. The other 103 are spread across 25 countries and territories, led by Canada (25), the United Kingdom (24), Australia (8) and Germany (6).
US and international clients report nearly the same organic traffic gain. The median is 100% for US clients (402 case studies, middle half 43% to 242%) and 106% for all international clients combined (37 case studies, middle half 41% to 296%).
No single country outside the US has enough data for its own benchmark. Only 8 UK case studies and 8 Canadian ones state an organic traffic gain, and only 1 Australian one does. We'll add country figures once each passes 20 data points.
Within the US, reported gains vary by state. Median organic traffic gain for the four states with 20 or more data points:
- New York: 182% (61% to 383%), 46 case studies
- Florida: 138% (44% to 270%), 21 case studies
- Texas: 106% (49% to 230%), 41 case studies
- California: 85% (42% to 238%), 117 case studies
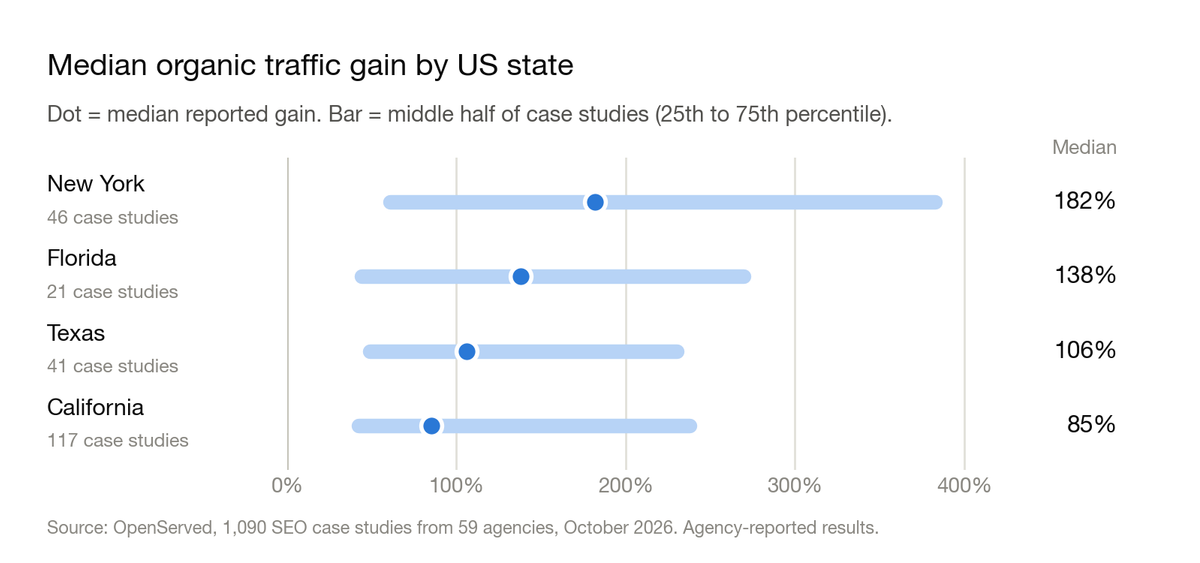
California accounts for 26% of US SEO case studies. 246 of the 929 US case studies are for California clients, followed by New York (89), Texas (78) and Florida (59).
How long SEO takes: what the data can't tell you
Fewer than 1% of SEO case studies say how long the work took. Only 6 of the 1,090 state an engagement length. That is too few to answer "how long does SEO take" from this dataset, so we don't try.
Only 18% mention any time period at all. 192 case studies include a time reference somewhere in their result stats, such as "year over year" or "in 6 months". The other 82% give a percentage with no window, so a reader can't tell whether a 100% gain took three months or three years.
Year-over-year organic traffic gains have a median of 130%. 45 case studies frame their organic traffic gain as a year-over-year comparison. Their middle half runs from 62% to 188%.
If you're comparing agencies, ask for the timeframe behind every number. A result without one isn't comparable to anything.
How SEO is sold: bundles and agencies
72% of SEO case studies bundle SEO with another service. Only 301 of the 1,090 list SEO alone. The average SEO case study lists 2.3 services.
PPC is the most common partner. PPC appears alongside SEO in 31% of SEO case studies, Content Marketing in 21%, Web Design in 21% and Web Development in 14%.
Three agencies publish 38% of the SEO case studies. Coalition Technologies has 275, NP Digital 77 and Big Leap 58. The typical agency has 8, and 25 of the 59 have five or fewer.
The headline number holds without the largest publisher. Excluding Coalition Technologies, the median organic traffic gain is 115% across 329 case studies, against 102% with it.
How much of this data is verified?
Only 3.5% of SEO case studies are Client-verified. 38 of the 1,090 carry OpenServed's Client-verified badge, meaning the named client confirmed the results. The other 96.5% are agency-reported.
There isn't enough verified data yet to compare the two. 17 verified case studies state an organic traffic gain, with a median of 85%, against 102% for the 445 agency-reported ones. Seventeen data points can't support a conclusion either way. We'll report the comparison once the verified group is large enough.
Keep this in mind with every number on this page. A published case study is an agency's best work, described in the agency's words. Without a client confirming it, it's a claim, not a benchmark.
What this means if you're hiring an SEO agency
- Treat a doubling of organic traffic as the typical published win, not a promise. The median case study reports 102%, and case studies are the campaigns that went well.
- Ask what the starting point was. A 500% gain from 200 visits a month is a smaller result than a 40% gain from 50,000.
- Ask for leads or revenue, not only traffic. Only 29% of SEO case studies report a lead or conversion result, so an agency that shows one is giving you more than most.
- Ask how keywords were counted. Top 3, page one and total ranking keywords give very different percentages for the same campaign.
- Ask for the timeframe. Fewer than 1% of case studies state one.
- Ask whether the client confirmed it. Only 3.5% of SEO case studies are Client-verified.
You can browse every case study behind these numbers in OpenServed's SEO agency directory, and filter by industry, client size and location.
Methodology
- Source: all 1,090 case studies in OpenServed's directory that list SEO as a service, as of October 4, 2026, from 59 agencies. Each links to the agency's own published case study. Case studies that list only Local SEO, Technical SEO or Link Building are not included.
- Result stats: each case study carries the result stats the agency published, as free text. We assigned each stat to a metric by keyword matching: organic traffic, total traffic, keywords and rankings, leads, conversions, conversion rate, and revenue.
- Percentages only: medians use stats that state a percentage change. Plain counts, dollar figures, multipliers such as "3x" and before-and-after pairs are left out.
- Other channels excluded: stats that name another channel, such as paid search, ads, social, email, Amazon or AI search, are not counted as SEO results.
- One data point per case study: if a case study has several stats for the same metric, we use the first one listed.
- Median and middle half: we report the median, not the average, because a handful of gains above 1,000% would distort an average. The middle half is the range from the 25th to the 75th percentile.
- Minimum sample: we report a segment only when it has at least 20 data points for that metric.
- Bundled services: 72% of these case studies list other services alongside SEO. Organic traffic and keyword stats are specific to SEO. Lead, conversion and revenue stats may reflect other channels unless the stat says "organic".
- Industry groups: we merged 128 industry labels into 13 groups for the roll-up figures. Client size uses employee count: small is 1 to 50, medium 51 to 200, large 201 to 1,000 and enterprise more than 1,000.
- Selection bias: agencies publish their wins, and the directory is not a random sample of the industry. One agency, Coalition Technologies, accounts for 25% of the SEO case studies.
- Agency-reported: except for the 38 Client-verified case studies, results are as published by each agency and haven't been independently confirmed.
Cite this data: OpenServed, "SEO Statistics 2026: Results From 1,000+ Agency Case Studies", October 2026, https://openserved.com/blog/seo-statistics
FAQs
How many SEO case studies did you analyze?
1,090 case studies from 59 agencies, as of October 2026. Each one lists SEO as a service and links to the agency's own published case study.
What is a good result from SEO?
The median SEO case study reports a 102% increase in organic traffic, and half fall between 43% and 254%. These are published wins, so a typical campaign is likely to land lower.
How much can SEO increase leads and revenue?
Among case studies that state a percentage, the median reported increase is 102% for leads, 120% for conversions and 110% for revenue. Only 29% of SEO case studies report a lead or conversion result at all.
Which industries see the biggest SEO gains?
Industrial and manufacturing clients report the highest median organic traffic gain at 138%, followed by home, property and local services at 137%. Education and nonprofit clients report the lowest at 73%.
Is SEO worth it for small businesses?
Small businesses with 1 to 50 employees make up 54% of SEO case studies and report a median organic traffic gain of 110%. That is higher than the 68% reported for mid-sized companies.
How long does SEO take to work?
This dataset can't answer that. Fewer than 1% of SEO case studies say how long the engagement ran, and only 18% mention any time period in their results.
Are these SEO results verified?
Mostly not. Only 3.5% of SEO case studies carry the Client-verified badge. The rest are reported by the agency and haven't been confirmed by the client.