
Web Design Statistics 2026: Results From 1,800+ Agency Case Studies
16 min readLast updated November 3, 2026
On this page
- Web design statistics at a glance
- What web design case studies report
- Web design traffic statistics
- Web design conversion and lead statistics
- Web design engagement, bounce rate and speed statistics
- Web design with SEO vs without SEO
- How web design is sold
- Web design statistics by industry
- Web design statistics by client size
- Web design statistics by country
- How long a website project takes: what the data can't tell you
- The agencies behind the data
- How much of this data is verified?
- What this means if you're hiring a web design agency
- Methodology
- FAQs
Most web design statistics come from surveys and lab tests: how fast visitors judge a site, how many leave a slow page, what share of traffic is mobile. They don't tell you what a redesign actually did for a client.
This page does. Every number below is counted from 1,833 web design case studies published by 192 marketing agencies, all indexed in OpenServed's directory. Each case study names a client and states the results the agency reported: traffic, leads, conversion rate, revenue, bounce rate, time on site and page speed.
Data as of November 2026. These are results agencies chose to publish, so they show what a successful website project looks like, not what an average one does. The directory keeps growing, so if you cite a number, please cite the date.
Web design statistics at a glance
- 1,833 web design case studies from 192 agencies, covering 147 industries and clients in 24 countries and territories.
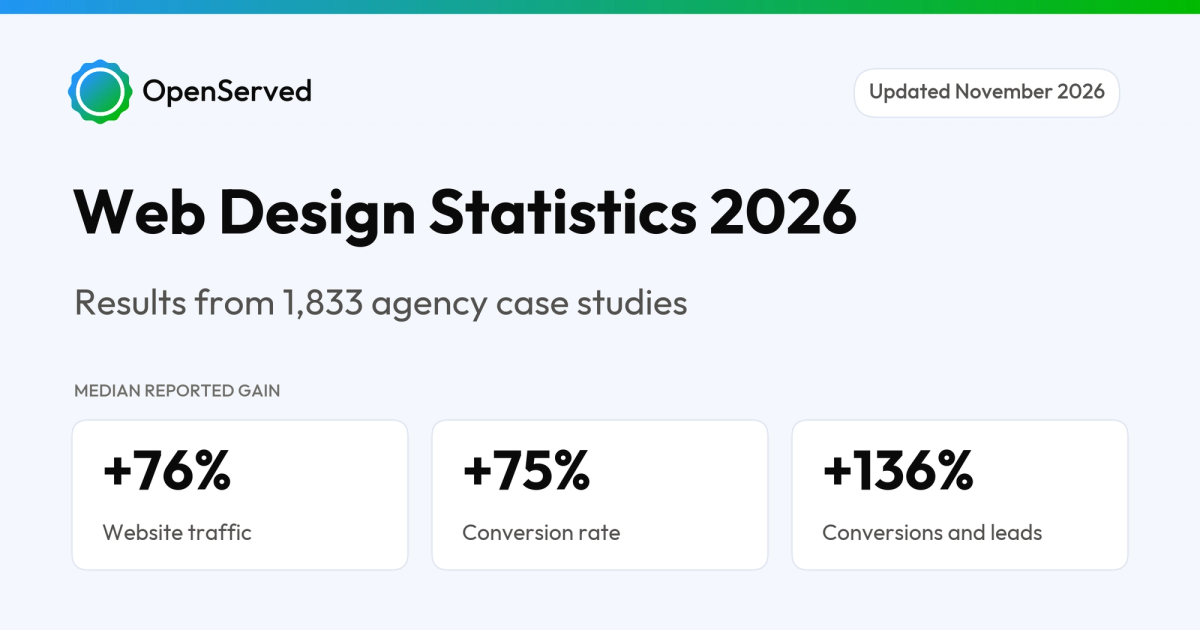
- 76% is the median reported increase in website traffic. Half of the 422 case studies that state one fall between 33% and 174%.
- 136% is the median reported increase in conversions or leads, across 206 case studies.
- 75% is the median reported increase in conversion rate (67 case studies) and 80% in revenue or sales (122 case studies).
- 15% is the median reported drop in bounce rate, and 46% the median reported cut in page load time.
- 35% of web design case studies contain no number at all. They describe what was built, not what it achieved.
- Only 34% report a business outcome: revenue, leads, conversions or conversion rate.
- Web design sold with SEO reports a measured result 80% of the time, against 38% without SEO.
- Small businesses are the largest client group, at 43% of case studies with a known size.
- Only 9% are Client-verified, and none record how long the project took.
What web design case studies report
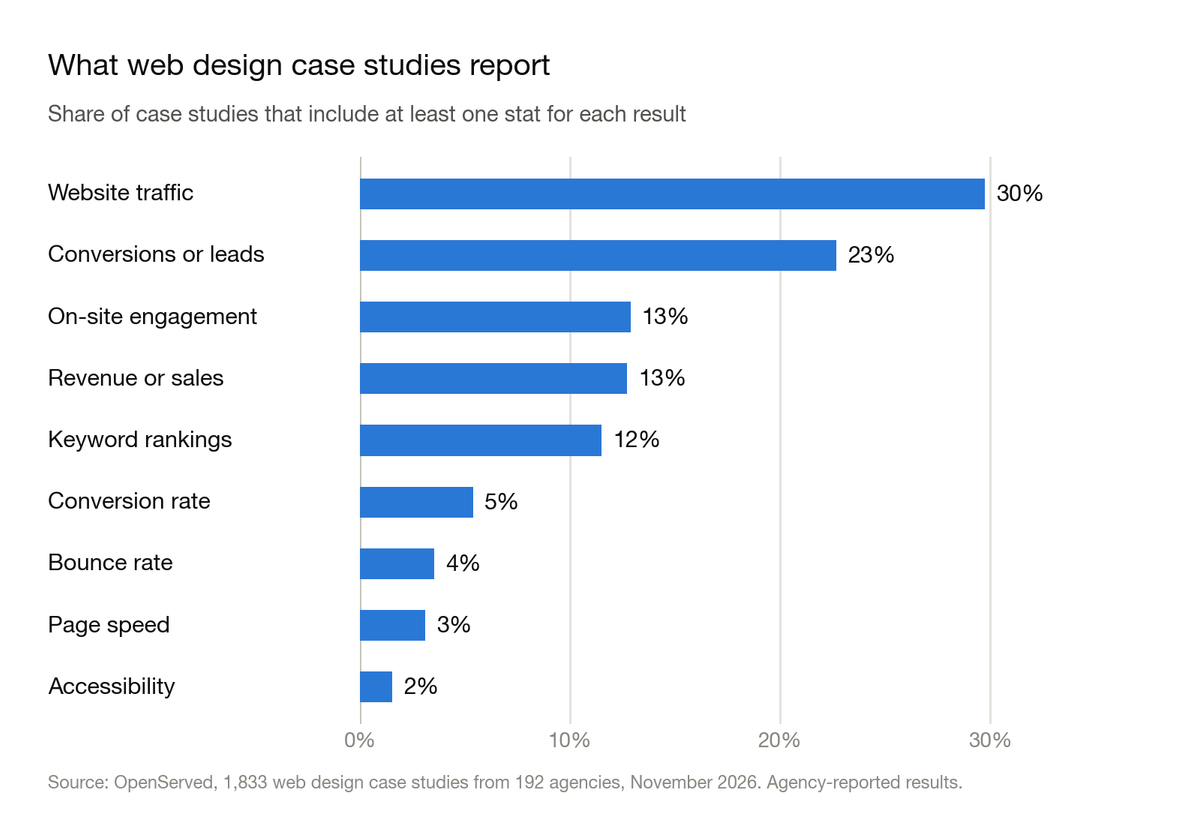
Traffic and leads are the results agencies report most. 30% of web design case studies include a website traffic stat and 23% a conversion or lead stat. On-site engagement, such as time on site, pages per session or engagement rate, appears in 13%, revenue or sales in 13% and keyword rankings in 12%. Conversion rate appears in only 5%, bounce rate in 4%, page speed in 3% and accessibility in 2%.
35% of web design case studies contain no number at all. 649 of the 1,833 list only what was delivered, such as "Membership platform and member login area", "Brand-new salon website launched on Studio V" or "Delivered web design, web development and digital marketing". They show the work, not the result.
Only 34% report a business outcome. That means revenue, leads, conversions or conversion rate. The other 66% stop at traffic, engagement or a description of the site.
Web design results are often descriptions, not percentages. Only 43% of result stats are percentages, against 62% for SEO and 68% for PPC. The 1,833 case studies carry 4,893 result stats, an average of 2.7 each, and a third of those stats contain no number.
Web design traffic statistics
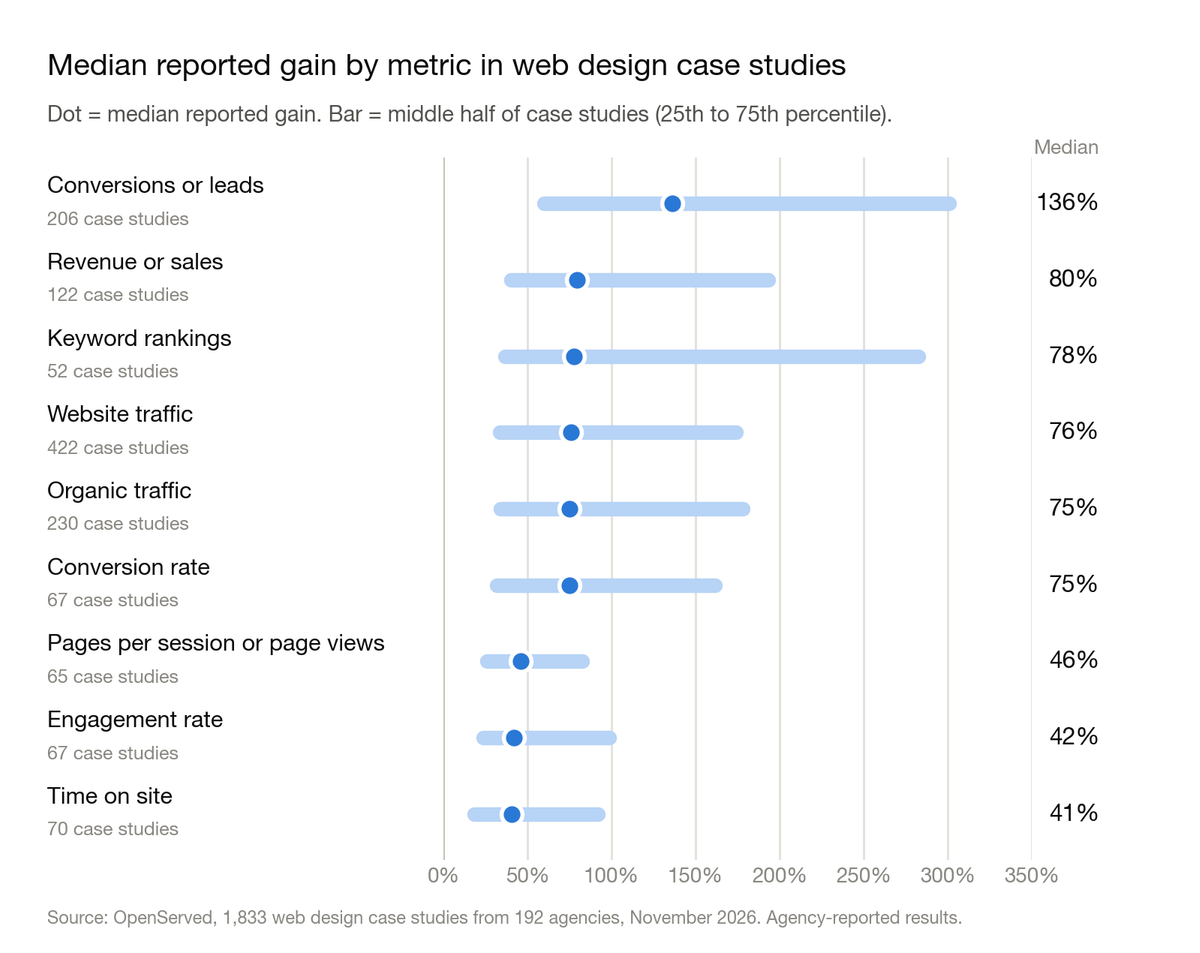
The median web design case study reports a 76% increase in website traffic. 422 case studies state a percentage gain in traffic, sessions or users. A quarter report 33% or less, and a quarter report 174% or more.
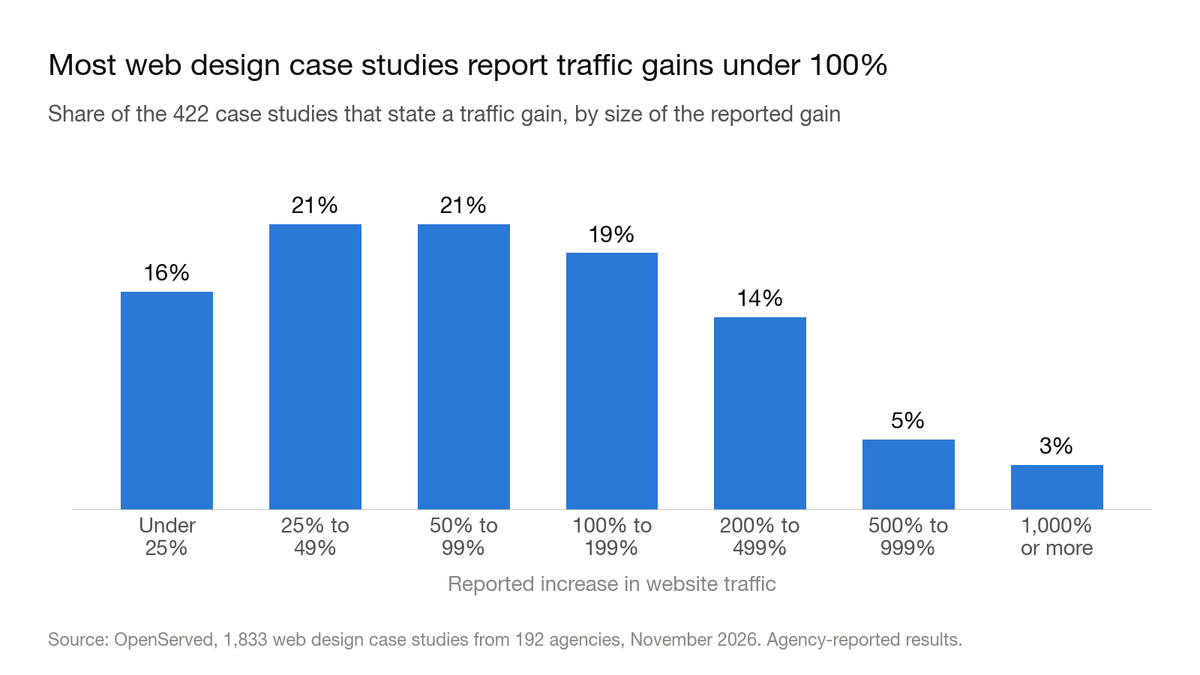
58% report a traffic gain under 100%. That is lower than the 118% median reported for content marketing. A redesign usually starts from a site that already has visitors, so percentage gains tend to be smaller. The full spread:
- Under 25%: 16% of case studies
- 25% to 49%: 21%
- 50% to 99%: 21%
- 100% to 199%: 19%
- 200% to 499%: 14%
- 500% to 999%: 5%
- 1,000% or more: 3%
Organic traffic grows about as much as traffic overall. Where the stat specifies organic or search traffic, the median gain is 75% across 230 case studies, with the middle half between 34% and 178%.
The median reported growth in keyword rankings is 78%. 52 case studies state one, with the middle half between 37% and 283%.
Web design conversion and lead statistics
The median reported increase in conversions or leads is 136%. 206 case studies state a percentage gain, with the middle half between 60% and 301%. Taken separately, the median is 146% for leads (150 case studies) and 124% for conversions (63 case studies).
Leads grow faster than traffic. The median lead gain is almost twice the median traffic gain, which fits what a redesign is meant to do: turn more of the same visitors into enquiries.
The median reported increase in conversion rate is 75%. 67 case studies state one, with the middle half between 32% and 162%. 42% report that the conversion rate at least doubled.
The median reported increase in revenue or sales is 80%. 122 case studies state one, with the middle half between 40% and 193%. This includes orders, transactions and average order value.
Web design engagement, bounce rate and speed statistics
The median reported increase in time on site is 41%. 70 case studies state one, with the middle half between 18% and 92%. Pages per session or page views rise by a median of 46% (65 case studies), and engagement rate by 42% (67 case studies).
The median reported drop in bounce rate is 15%. 53 case studies state one, with the middle half between 9% and 25%. That is a relative drop: a bounce rate of 60% falling by 15% ends at 51%.
The median reported cut in page load time is 46%. 22 case studies state one, with the middle half between 26% and 64%. That figure rests on few data points, so treat it as a rough guide.
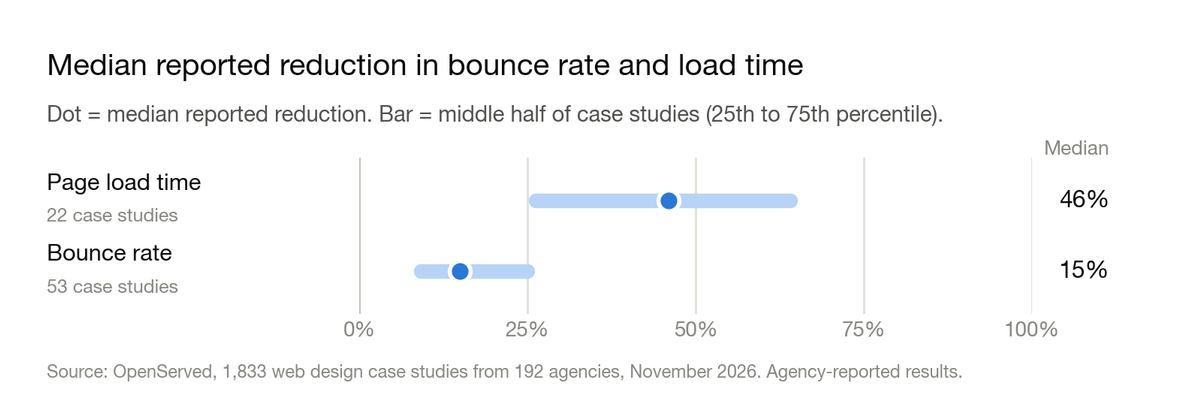
Speed and accessibility are rarely measured. Only 3% of web design case studies give a page speed result and 2% mention accessibility or WCAG. Only 5% mention mobile at all.
Few case studies name the platform. 7% name a content management or ecommerce platform in their results. WordPress is named most often, in 72 case studies, followed by HubSpot (17) and Magento or Adobe Commerce (16).
Web design with SEO vs without SEO
Web design is sold in two different ways. 689 of the 1,833 case studies (38%) also list SEO as a service, and 1,144 (62%) don't. The two groups report very different things.
With SEO, agencies report results. Without SEO, they mostly describe the site. 80% of case studies that include SEO report at least one measured result, against 38% of those that don't. A traffic stat appears in 51% against 17%, a revenue, lead or conversion stat in 43% against 28%, and a keyword ranking stat in 24% against 4%.
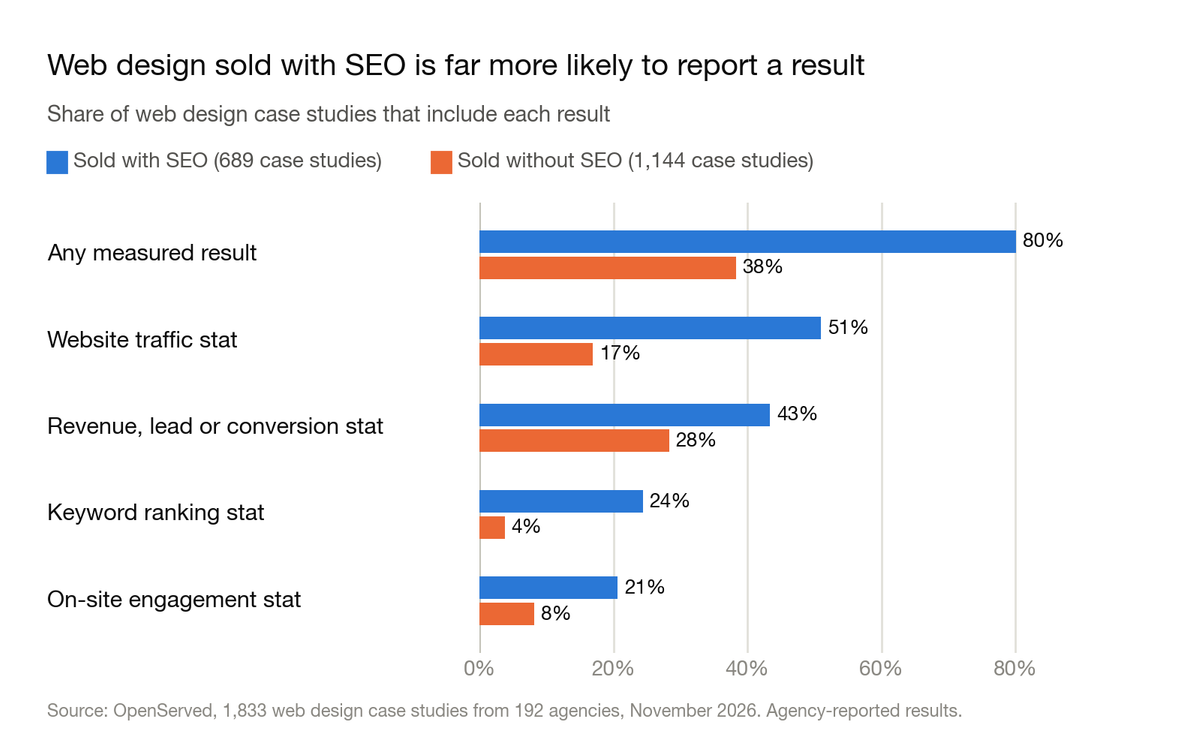
The clients are different too. Where web design is sold with SEO, 58% of clients with a known size are small businesses and 6% are enterprises. Without SEO, 34% are enterprises and 27% are small businesses.
With SEO, reported gains are higher across the board. The median reported traffic gain is 81% with SEO (288 case studies) against 61% without (134). For conversions or leads it is 163% (120 case studies) against 110% (86), and for revenue 100% (55) against 56% (67).
Conversion rate is the exception that needs care. The median conversion rate gain is 129% with SEO, but on only 27 case studies, against 49% without (40 case studies).
How web design is sold
94% of web design case studies bundle another service. Only 119 of the 1,833 list Web Design alone. The average case study lists 2.5 services.
Web development and SEO are the most common partners. Web Development appears alongside in 38% of web design case studies, SEO in 38%, Branding in 21%, PPC in 17%, Content Marketing in 12% and Social Media Ads in 6%. For the development side, see Web Development Statistics 2026 and Web Design vs Web Development.
Rebrands rarely report results. Only 33% of web design case studies that include Branding report a measured result, against 60% of those that don't.
Web design with conversion rate optimization reports outcomes most. Of the 91 case studies that also list CRO, 75% report revenue, leads, conversions or conversion rate.
Design-only case studies report a median 47% traffic gain. That rests on 23 case studies, the only metric with enough data for design sold alone.
Web design statistics by industry
To make 147 industry labels comparable, we rolled them up into 13 groups (see methodology).
Manufacturers are the biggest buyers. Industrial & Manufacturing accounts for 15% of web design case studies (280), followed by Home, Property & Local Services (13%), Software & Technology (11%), Healthcare & Wellness (11%) and Professional & B2B Services (10%). Manufacturing alone is the most common label, with 128 case studies.
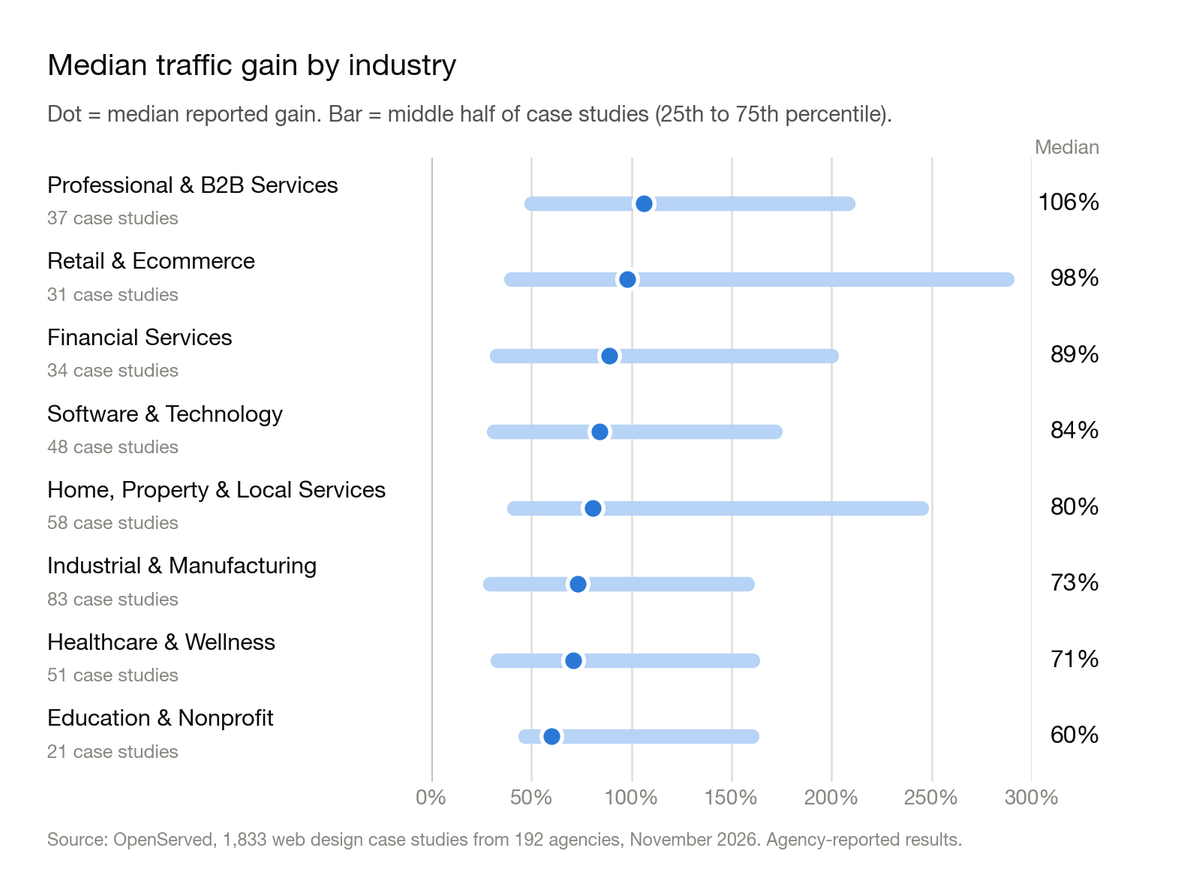
Professional and B2B services report the highest median traffic gain, at 106%. Median reported traffic gain for the eight groups with at least 20 data points, with the middle half in brackets:
- Professional & B2B Services: 106% (50% to 208%), 37 case studies
- Retail & Ecommerce: 98% (40% to 288%), 31 case studies
- Financial Services: 89% (33% to 200%), 34 case studies
- Software & Technology: 84% (31% to 172%), 48 case studies
- Home, Property & Local Services: 80% (41% to 245%), 58 case studies
- Industrial & Manufacturing: 73% (29% to 158%), 83 case studies
- Healthcare & Wellness: 71% (33% to 161%), 51 case studies
- Education & Nonprofit: 60% (47% to 160%), 21 case studies
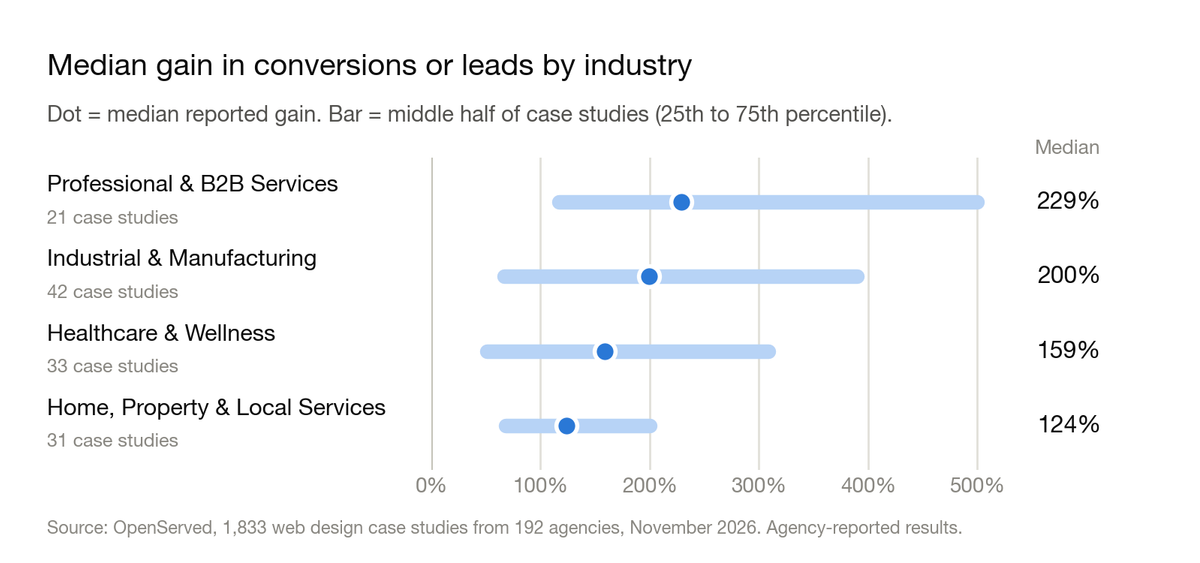
Professional services and manufacturers also report the largest gains in conversions or leads. The median is 229% for Professional & B2B Services (21 case studies) and 200% for Industrial & Manufacturing (42), against 159% for Healthcare & Wellness (33) and 124% for Home, Property & Local Services (31).
Retail and ecommerce clients report a median 71% increase in revenue or sales. 33 case studies state one, with the middle half between 45% and 150%. No other group has 20 data points.
Some industries rarely measure their websites. At least one measured result appears in 72% of Automotive case studies and 66% of Fashion, Beauty & Jewelry ones, but only 41% of Education & Nonprofit and 36% of Media & Entertainment ones.
Web design statistics by client size
Client size is the client's employee count. It is recorded for 584 of the 1,833 case studies (32%), so this section covers only those.
Small businesses are the largest client group, at 43%. Of the 584 with a known size, 252 involve small businesses (1 to 50 employees), 135 medium businesses (51 to 200), 83 large businesses (201 to 1,000) and 114 enterprises (more than 1,000).
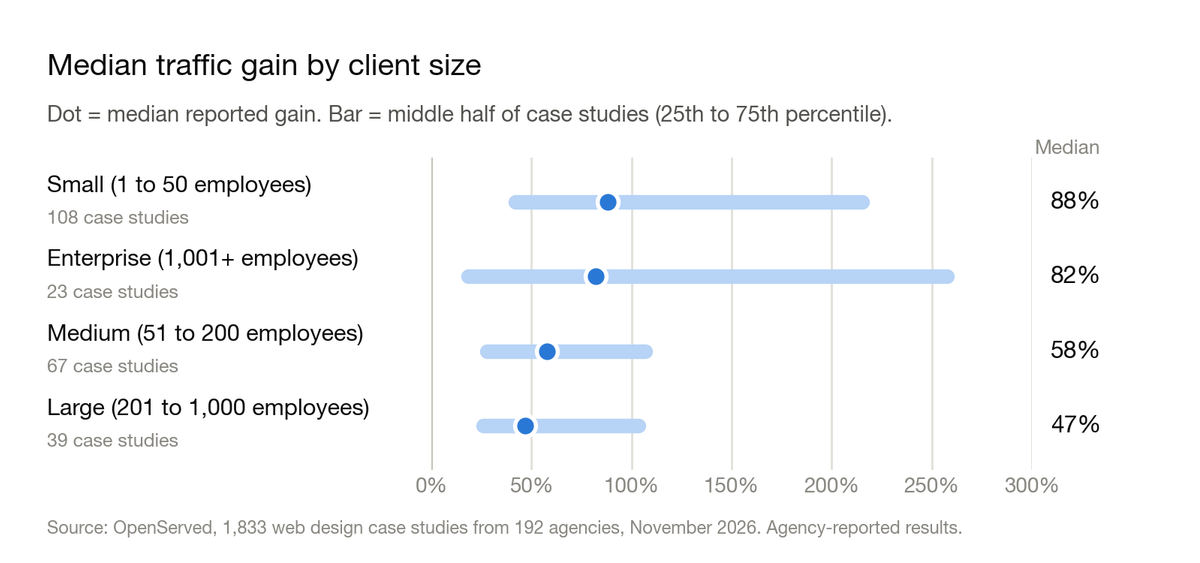
Small businesses report the largest traffic gains. Median reported traffic gain by client size, with the middle half in brackets:
- Small (1 to 50 employees): 88% (42% to 215%), 108 case studies
- Medium (51 to 200): 58% (28% to 107%), 67 case studies
- Large (201 to 1,000): 47% (26% to 103%), 39 case studies
- Enterprise (1,000+): 82% (19% to 258%), 23 case studies
Small businesses also report larger lead gains. The median gain in conversions or leads is 141% for small businesses (43 case studies, middle half 68% to 403%) against 93% for medium businesses (25). Large and enterprise clients have too few data points to report.
Engagement gains are similar at every size with enough data. The median gain in time on site, pages per session or engagement rate is 43% for small businesses (42 case studies), 34% for medium (30) and 50% for large (24).
Small businesses buy web design with SEO; enterprises buy it without. SEO is listed alongside in 69% of small-business case studies, 53% of medium, 41% of large and 16% of enterprise ones.
Web design statistics by country
Country is the client's location, not the agency's. It is recorded for 1,107 of the 1,833 case studies (60%), so this section covers only those.
81% of web design case studies are for US clients. 894 of the 1,107 located case studies are in the United States. The other 213 are spread across 23 countries and territories, led by the United Kingdom (67), Canada (64) and the United Arab Emirates (22).
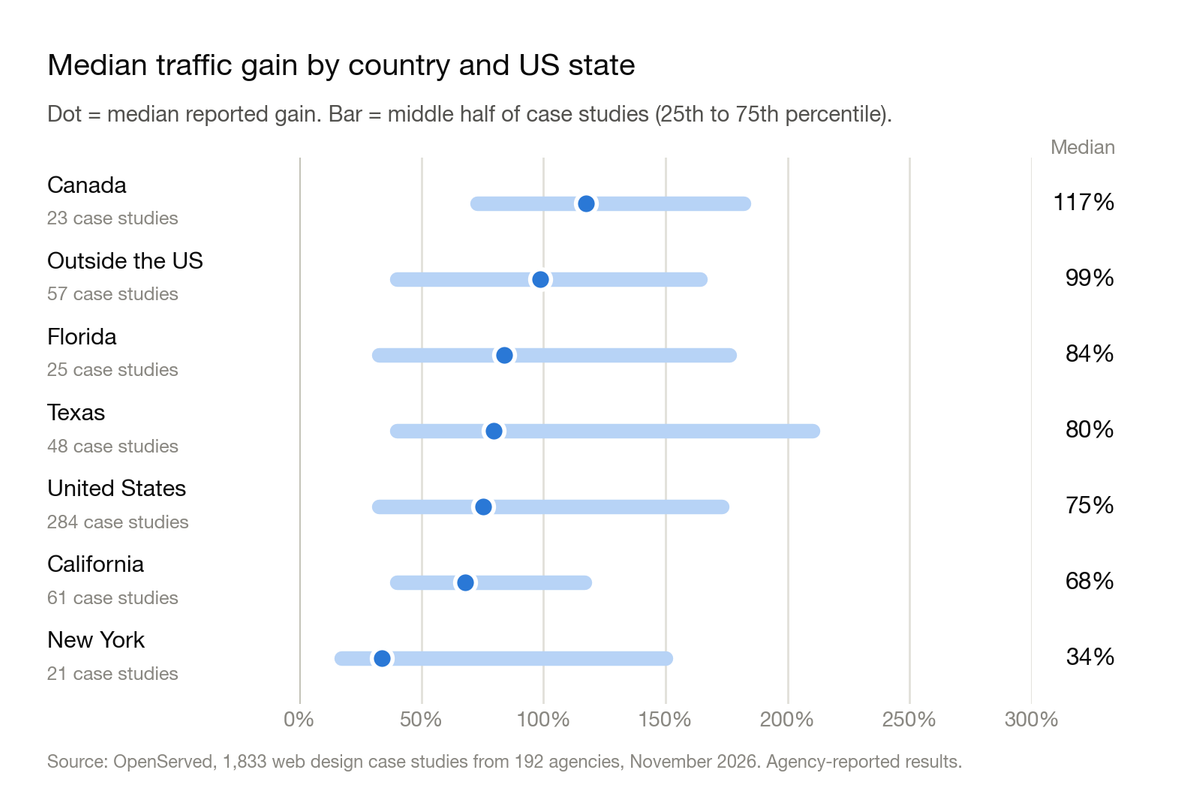
US clients report a median 75% increase in traffic. 284 US case studies state one, with the middle half between 32% and 173%. The median gain is 141% in conversions or leads (137 case studies), 90% in conversion rate (43) and 83% in revenue (65).
Clients outside the US report a median 99% increase in traffic. 57 case studies state one, with the middle half between 40% and 164%. The median gain in conversions or leads is 114% (22 case studies).
Canadian clients report a median 117% increase in traffic. 23 case studies state one, with the middle half between 73% and 182%. No other country outside the US has 20 data points.
Texas has the most web design case studies of any US state. 150 of the 894 are for Texas clients, followed by California (130), New York (78) and Florida (74). The median reported traffic gain is 84% for Florida (25 case studies), 80% for Texas (48), 68% for California (61) and 34% for New York (21). Texas clients also report a median 248% gain in conversions or leads (28 case studies).
How long a website project takes: what the data can't tell you
None of the 1,833 case studies records how long the project took. Agencies don't state build time or how long after launch the results were measured, so we can't say how long a redesign takes to pay off.
Only 12% mention any time period at all. 212 case studies include a time reference somewhere in their result stats, such as "year over year" or "in 45 days". The other 88% give a result with no window.
If you're comparing agencies, ask when each number was measured. A traffic gain in the first month after launch and the same gain a year later are different results.
The agencies behind the data
Three agencies publish 13% of the web design case studies. Coalition Technologies has 81, JSL Marketing & Web Design 76 and Bop Design 74. Half the agencies have four or fewer.
The traffic number is higher without the largest publisher. Bop Design supplies 73 of the 422 traffic data points; without it, the median traffic gain is 85%, against 76% with it. Coalition Technologies supplies 27 of the 122 revenue data points; without it, the median revenue gain is 71%, against 80% with it.
How much of this data is verified?
Only 9% of web design case studies are Client-verified. 157 of the 1,833, from 77 agencies, carry OpenServed's Client-verified badge, meaning the named client confirmed the results. The other 91% are agency-reported.
Verified results are not lower. The median traffic gain is 82% for verified case studies (33 data points) against 75% for agency-reported ones (389). The median gain in conversions or leads is 200% for verified case studies (27) against 124% for agency-reported ones (179). Revenue and conversion rate have too few verified data points to compare.
Keep this in mind with every number on this page. A published case study is an agency's best work, described in the agency's words. Without a client confirming it, it's a claim, not a benchmark.
What this means if you're hiring a web design agency
- Ask what the site achieved, not only what it looks like. 35% of web design case studies contain no number at all.
- Treat a 76% traffic gain as the typical published win, not a promise. Half of the case studies that report traffic stay under that, and these are the projects that went well.
- Ask for leads or revenue. Only 34% of web design case studies report a business outcome, and leads are where a redesign shows most: a median 136% gain.
- Decide whether you need SEO too. Web design sold with SEO reports higher traffic, lead and revenue gains, and is twice as likely to report a result at all.
- Ask about speed and accessibility. Only 3% of case studies measure page speed and 2% mention accessibility.
- Ask when the results were measured. None of the 1,833 case studies record how long the project took.
- Ask whether the client confirmed it. Only 9% of web design case studies are Client-verified.
You can browse every case study behind these numbers in OpenServed's web design agency directory, and filter by industry, client size and location.
Methodology
- Source: all 1,833 case studies in OpenServed's directory that list Web Design as a service, as of November 3, 2026, from 192 agencies. Each links to the agency's own published case study.
- Result stats: each case study carries the result stats the agency published, as free text. We assigned each stat to a metric by keyword matching: traffic, keyword rankings, leads, conversions, conversion rate, revenue, bounce rate, time on site, pages per session, engagement rate, page speed and accessibility.
- Percentages only: medians use stats that state a percentage change. Plain counts, dollar figures and before-and-after pairs are left out, though they still count toward what case studies report. For page load time, a before-and-after pair in seconds is converted to a percentage cut.
- Reductions: bounce rate and load time are reported as reductions. Reductions of 100% or more are left out.
- Other channels excluded: stats that name paid media, ads, cost per acquisition, ROAS, email, Amazon or social media are not counted as web design results. That removes 8% of all stats. Organic and SEO stats are kept, because a new site affects search traffic.
- One data point per case study: if a case study has several stats for the same metric, we use the first one listed. Conversions and leads are combined, using whichever comes first.
- Median and middle half: we report the median, not the average, because a handful of gains above 1,000% would distort an average. The middle half is the range from the 25th to the 75th percentile.
- Minimum sample: we report a segment only when it has at least 20 data points for that metric.
- Missing details: client size is recorded for 32% of these case studies and location for 60%, so those sections cover only the case studies that have them.
- Bundled services: 94% of these case studies list other services alongside Web Design, most often Web Development and SEO. Results can't be attributed to design alone.
- Industry groups: we merged 147 industry labels into 13 groups for the roll-up figures. Client size uses employee count: small is 1 to 50, medium 51 to 200, large 201 to 1,000 and enterprise more than 1,000.
- Selection bias: agencies publish their wins, and the directory is not a random sample of the industry. Three agencies account for 13% of these case studies.
- Agency-reported: except for the 157 Client-verified case studies, results are as published by each agency and haven't been independently confirmed.
Cite this data: OpenServed, "Web Design Statistics 2026: Results From 1,800+ Agency Case Studies", November 2026, https://openserved.com/blog/web-design-statistics
FAQs
How many web design case studies did you analyze?
1,833 case studies from 192 agencies, as of November 2026. Each one lists Web Design as a service and links to the agency's own published case study.
How much does a website redesign increase traffic?
The median case study reports a 76% increase in website traffic, and half fall between 33% and 174%. These are published wins, so a typical project is likely to land lower.
How much can a new website increase leads and conversions?
Among case studies that state a percentage, the median reported increase is 136% for conversions or leads and 75% for conversion rate. Only 34% of web design case studies report a lead, conversion or revenue result at all.
Does a redesign lower bounce rate?
Where a case study reports it, the median drop in bounce rate is 15%, and half fall between 9% and 25%. Only 4% of web design case studies report bounce rate.
Does web design work better with SEO?
Case studies that pair web design with SEO report higher median gains in traffic (81% against 61%), conversions or leads (163% against 110%) and revenue (100% against 56%). They are also twice as likely to report any measured result.
Is web design worth it for small businesses?
Small businesses with 1 to 50 employees are 43% of case studies with a known size. They report a median 88% increase in traffic and a 141% gain in conversions or leads, against 93% for medium-sized businesses.
How long does a website redesign take to show results?
This dataset can't answer that. None of the 1,833 case studies record how long the project ran, and only 12% mention any time period in their results.
Are these results verified?
Mostly not. Only 9% of web design case studies carry the Client-verified badge. The rest are reported by the agency and haven't been confirmed by the client. Where the two can be compared, verified results are no lower.