
Lead Generation Statistics 2026: Results From 800+ Agency Case Studies
14 min readLast updated November 3, 2026
On this page
- Lead generation statistics at a glance
- What lead generation case studies report
- Meetings booked: appointment-setting statistics
- Leads and pipeline statistics
- Cost per lead statistics
- Marketing-led vs sales-led lead generation
- How lead generation is sold
- Lead generation statistics by industry
- Lead generation statistics by client size
- Lead generation statistics by country
- How long lead generation takes: what the data can tell you
- The agencies behind the data
- How much of this data is verified?
- What this means if you're hiring a lead generation agency
- Methodology
- FAQs
Most lead generation statistics come from surveys of marketers: which channels they say work best, what they spend, how hard they find it to get leads. They don't tell you how many leads or meetings an agency actually delivered for a client.
This page does. Every number below is counted from 807 lead generation case studies published by 113 marketing and sales agencies, all indexed in OpenServed's directory. Each case study names a client and states the results the agency reported: leads, meetings booked, sales pipeline, cost per lead and revenue.
Data as of November 2026. These are results agencies chose to publish, so they show what a successful program looks like, not what an average one does. The directory keeps growing, so if you cite a number, please cite the date.
Lead generation statistics at a glance
- 807 lead generation case studies from 113 agencies, covering 105 industries and clients in 42 countries and territories.
- 11 meetings a month is the median for appointment-setting programs. Half of the 93 case studies that state meetings booked over a period fall between 8 and 17.
- 28 leads a month is the median across 73 case studies that state leads over a period, with half between 11 and 72.
- 90% is the median reported increase in leads, across 95 case studies.
- 42% is the median reported cut in cost per lead or acquisition, across 51 case studies.
- $2.7 million is the median sales pipeline reported, across 40 case studies that put a dollar value on it.
- Only 37% of lead generation results are percentages, lower than for any service we've covered except branding. Most are counts: leads, meetings, deals.
- Lead generation is two businesses. When it is sold with ads, SEO, content or web work, case studies count leads and cost per lead. Without them, 40% count meetings booked.
- Software and technology companies are the biggest buyers, at 31% of case studies.
- 15% are Client-verified, among the highest shares of any service.
What lead generation case studies report
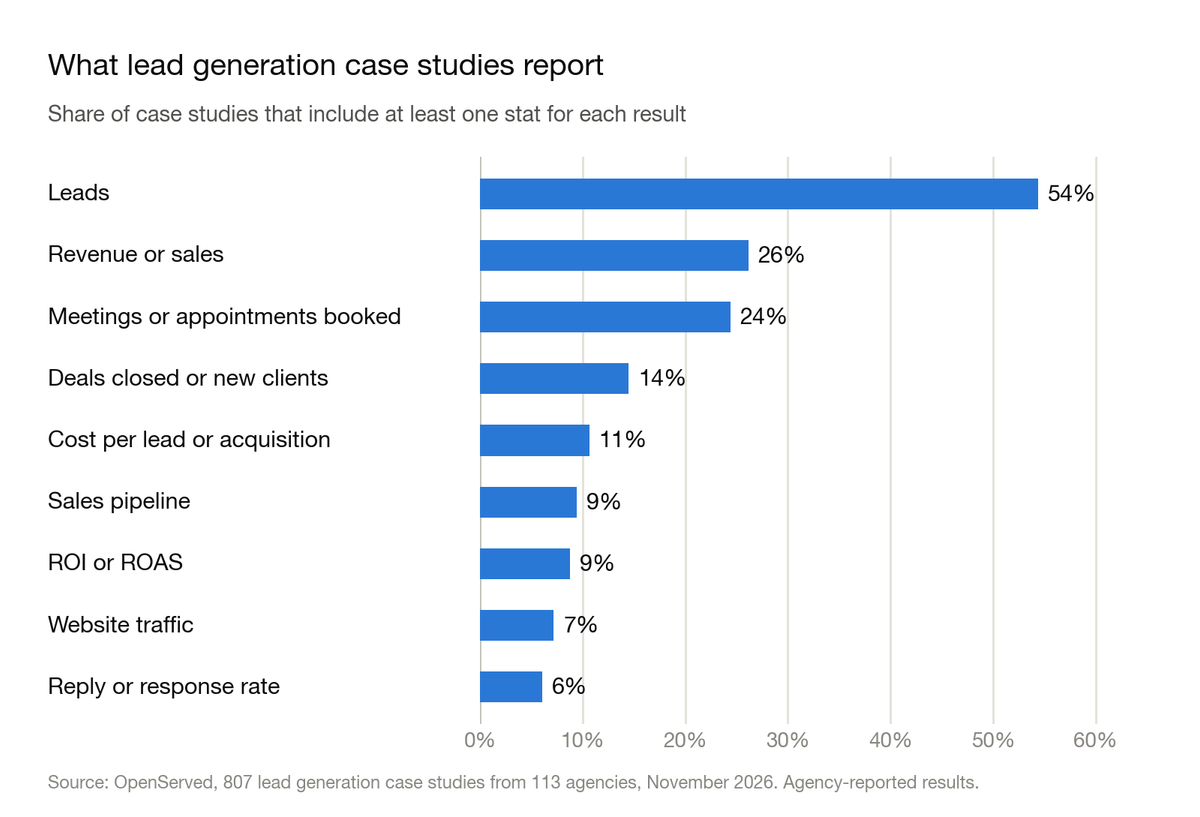
Leads are the result agencies report most. 54% of lead generation case studies include a lead stat. Revenue or sales appears in 26%, meetings or appointments booked in 24%, deals closed or new clients in 14%, cost per lead or acquisition in 11% and sales pipeline in 9%. ROI or ROAS appears in 9%, website traffic in 7% and a reply or response rate in 6%.
Lead generation results are counts, not percentages. Only 37% of result stats are percentages, against 62% for SEO and 68% for PPC. Only 32% of case studies state a percentage change at all. The rest report numbers such as "80 appointments booked in 7 months" or "$397K in pipeline in 5 months".
Counts mean little without a time period. 290 case studies state a number of leads or meetings. Where they also say over what period, we converted the count to a monthly rate, which is what the next two sections report.
Only 9% contain no number at all. 71 of the 807 describe the work without a result, such as "Databox integrated with HubSpot to align sales and marketing". The 807 case studies carry 2,188 result stats, an average of 2.7 each.
Meetings booked: appointment-setting statistics
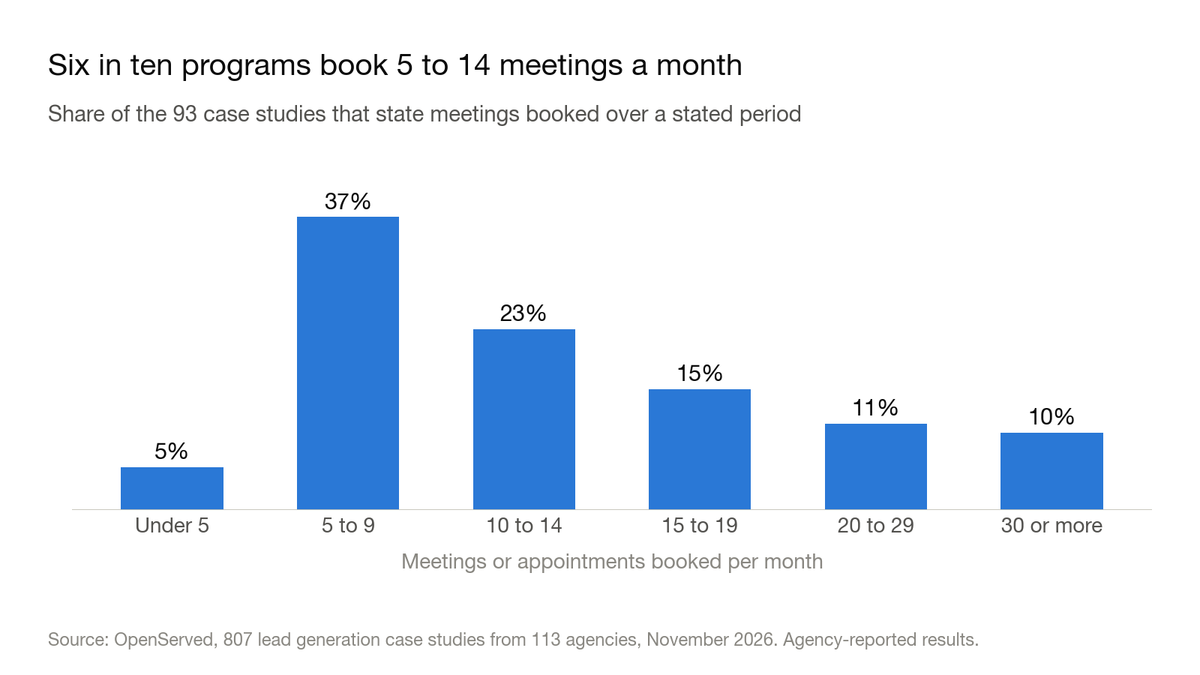
The median appointment-setting program books 11 meetings a month. 93 case studies state a number of meetings or appointments and the period it took, such as "50 appointments booked in 6 months". Half fall between 8 and 17 a month.
Six in ten book 5 to 14 meetings a month. The full spread:
- Under 5 a month: 5% of case studies
- 5 to 9: 37%
- 10 to 14: 23%
- 15 to 19: 15%
- 20 to 29: 11%
- 30 or more: 10%
One agency supplies half of these figures. Belkins accounts for 49 of the 93, with a median of 10 meetings a month. Without Belkins, the median is 14 meetings a month across 44 case studies.
The median reported reply rate is 17%. 47 case studies state a reply or response rate for outreach, with the middle half between 7% and 36%. SalesAR supplies 24 of the 47; without it, the median is 36%.
Leads and pipeline statistics
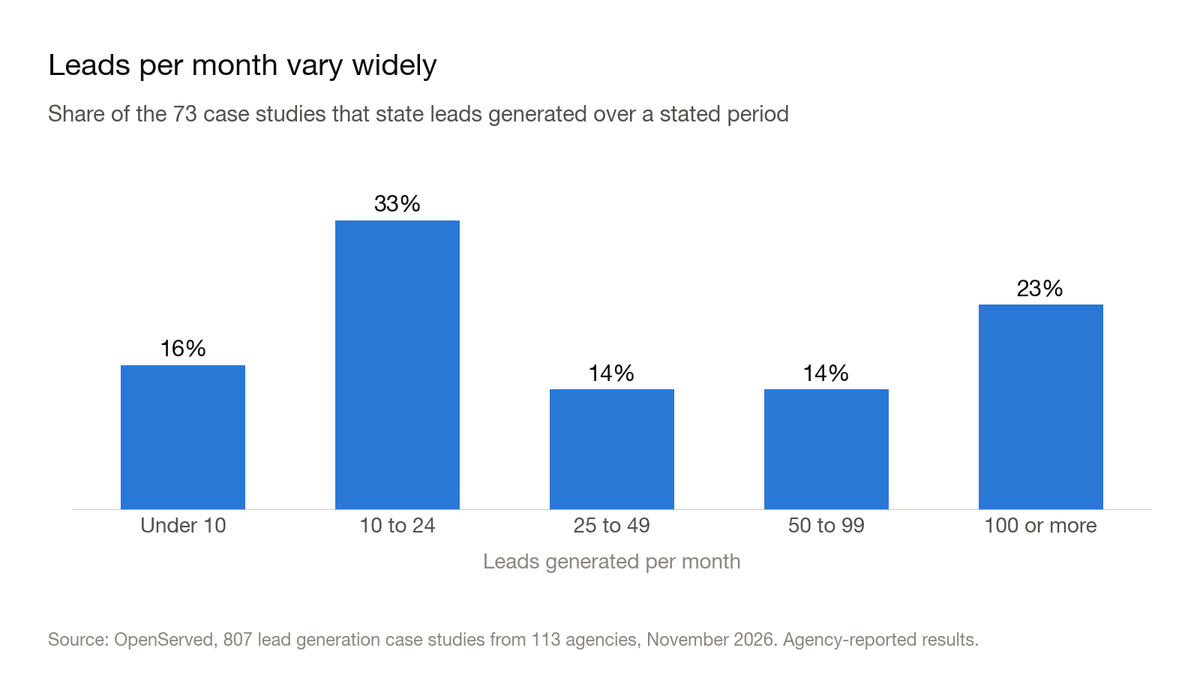
The median program that states its lead volume generates 28 leads a month. 73 case studies give a number of leads and the period, with half between 11 and 72 a month. A quarter report fewer than 10 a month and nearly a quarter report 100 or more, so lead volume varies more than meeting volume.
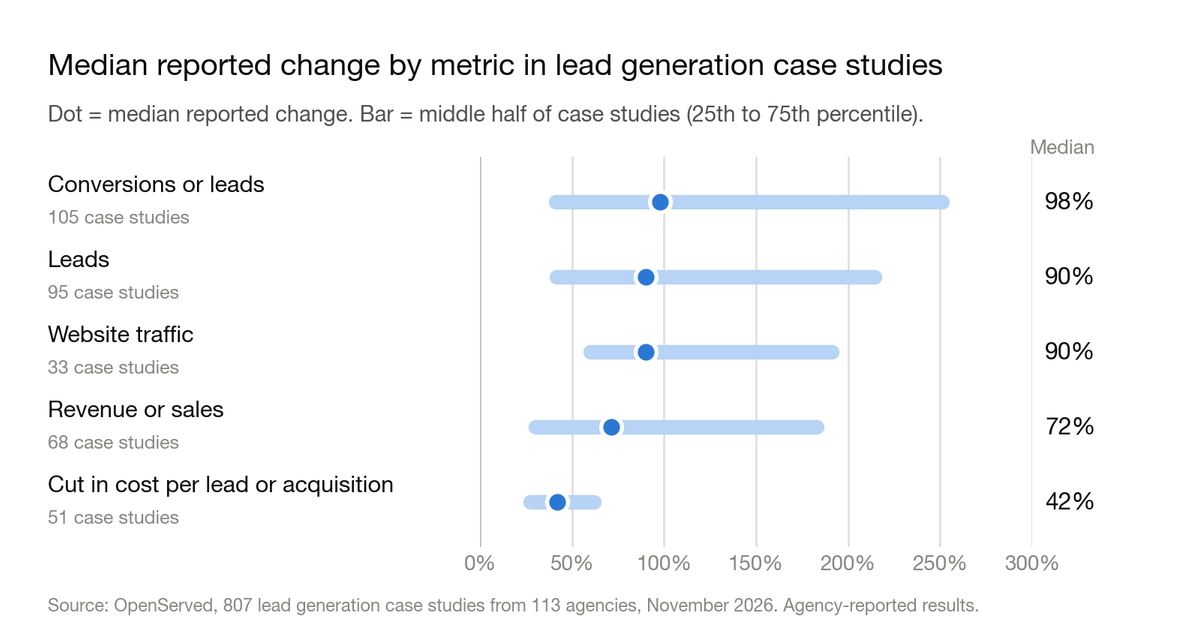
The median reported increase in leads is 90%. 95 case studies state a percentage gain in leads, with the middle half between 42% and 215%. Combined with conversions, the median is 98% across 105 case studies.
The median sales pipeline reported is $2.7 million. 40 case studies put a dollar value on the pipeline they built, with the middle half between $850,000 and $8.5 million. Pipeline is the value of deals in progress, not closed revenue, and agencies define it differently.
The median reported increase in revenue or sales is 72%. 68 case studies state one, with the middle half between 30% and 183%. Acceleration Partners, an affiliate agency, supplies 23 of the 68.
Cost per lead statistics
Lead generation cuts cost per lead by a median of 42%. 51 case studies state a percentage cut in cost per lead or cost per acquisition, with the middle half between 28% and 62%.
Cost per lead is a paid-media metric. 49% of lead generation case studies that also list PPC report a cost per lead or acquisition, against 4% of those that don't. Few case studies state the cost per lead itself in dollars, so we can't give a typical price.
Marketing-led vs sales-led lead generation
Lead generation is two different businesses. 320 of the 807 case studies (40%) also list paid ads, SEO, content marketing or web design: the agency brings leads in through marketing. The other 487 don't, and many of them are outbound programs where the agency contacts prospects directly by email, LinkedIn or phone.
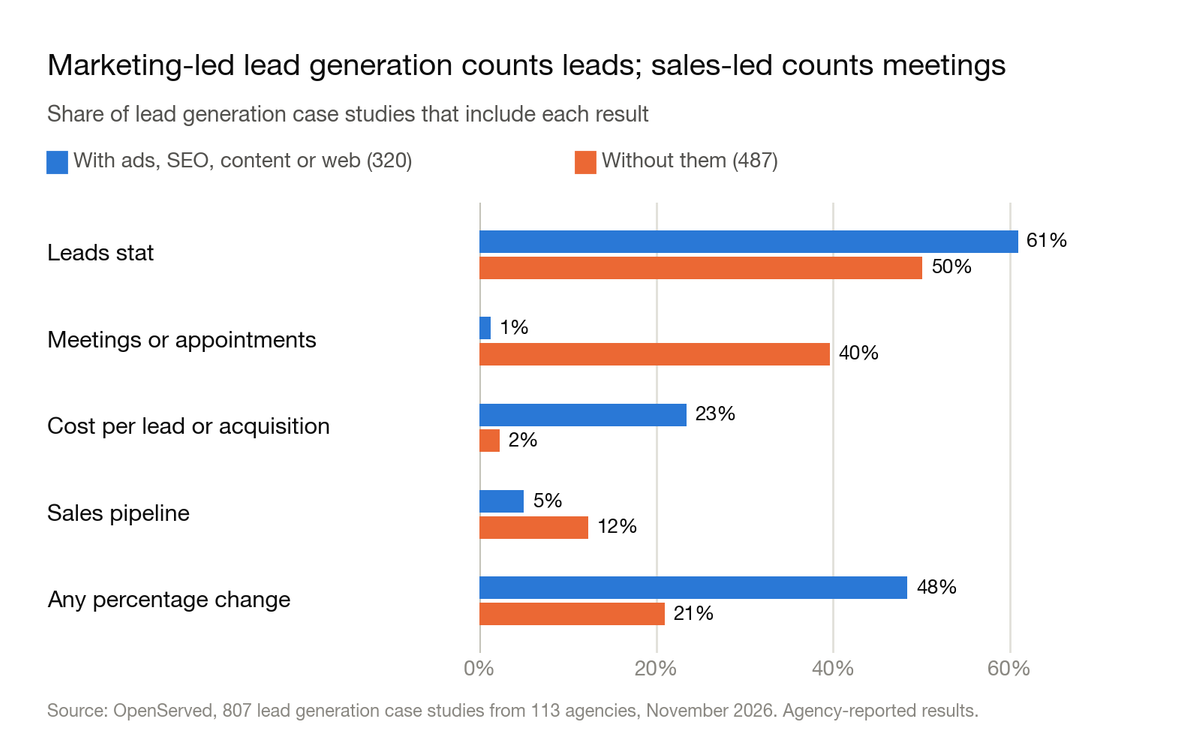
Marketing-led programs count leads; sales-led programs count meetings. A meeting or appointment stat appears in 40% of sales-led case studies, against 1% of marketing-led ones. A cost per lead stat goes the other way: 23% against 2%. Marketing-led case studies are also more than twice as likely to state a percentage change, 48% against 21%.
Marketing-led programs report more leads. They report a median of 50 leads a month (38 case studies), against 11 for sales-led programs (35). Their median lead gain is 120% (71 case studies), and their median cut in cost per lead is 43% (48).
Sales-led programs report meetings and pipeline. They report a median of 11 meetings a month (93 case studies), a median pipeline of $1.9 million (32) and a median reply rate of 17% (47). Fewer leads, but each one is a booked conversation.
How lead generation is sold
37% of lead generation case studies are about lead generation alone. 295 of the 807 list no other service, the highest share of any service we've covered. The average case study lists 1.9 services.
Email marketing is the most common partner. Email Marketing appears alongside in 25% of lead generation case studies, PPC in 15%, Content Marketing in 12%, Social Media Ads in 10%, Web Design in 8% and SEO in 8%.
Lead generation sold with PPC reports the largest lead gains. The median lead gain is 154% when PPC is also listed (38 case studies), against 70% when it isn't (57).
Lead generation statistics by industry
To make 105 industry labels comparable, we rolled them up into 13 groups (see methodology).
Software and technology companies are the biggest buyers by far. Software & Technology accounts for 31% of lead generation case studies (247), followed by Industrial & Manufacturing (15%), Professional & B2B Services (12%), Home, Property & Local Services (10%), Healthcare & Wellness (8%) and Financial Services (8%). SaaS alone is the most common label, with 75 case studies.
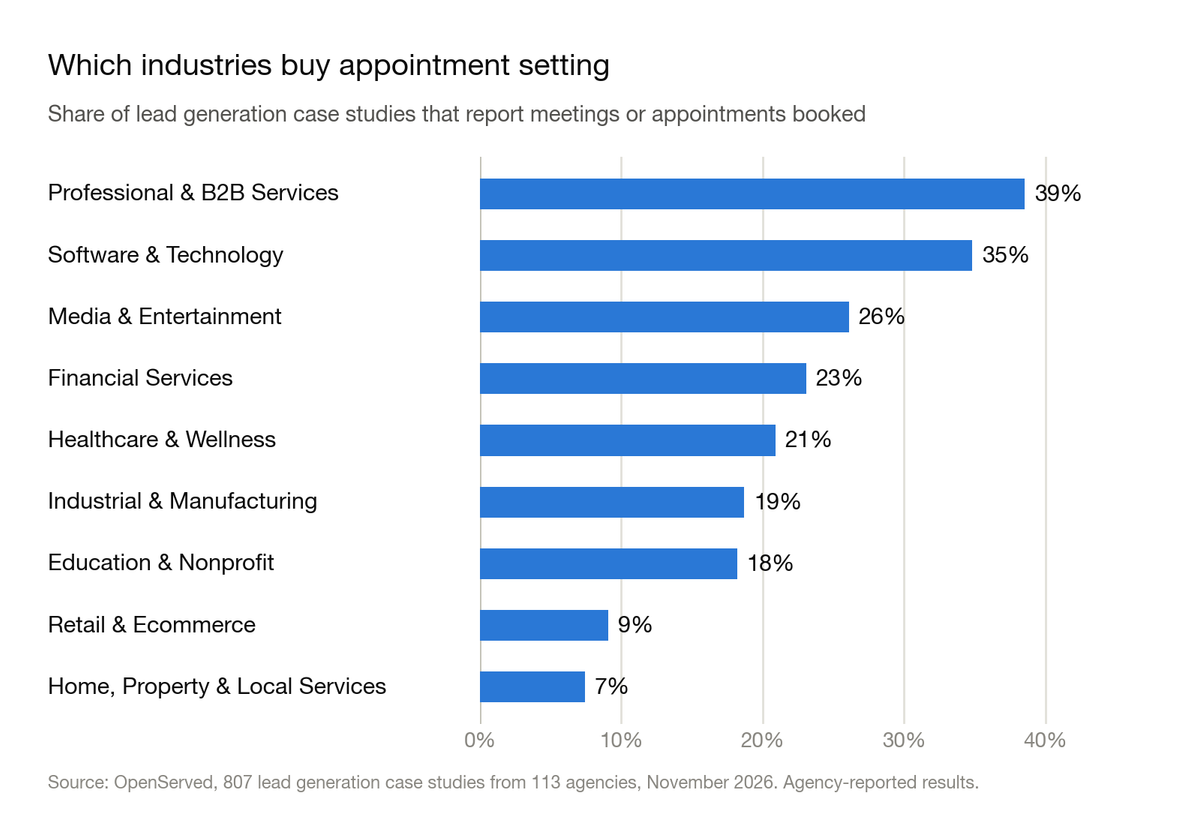
B2B firms buy appointment setting; local businesses don't. Meetings or appointments are reported in 39% of Professional & B2B Services case studies and 35% of Software & Technology ones, but only 9% of Retail & Ecommerce and 7% of Home, Property & Local Services ones.
Software and technology clients report a median 88% increase in leads. 27 case studies state one, with the middle half between 40% and 240%. They book a median of 12 meetings a month (27 case studies) and report a median pipeline of $5 million (22 case studies).
Manufacturers also report a median 88% increase in leads. 24 case studies state one, with the middle half between 50% and 168%.
Professional and B2B services firms book a median of 10 meetings a month. 22 case studies state it, with the middle half between 8 and 14.
Lead generation statistics by client size
Client size is the client's employee count. It is recorded for 384 of the 807 case studies (48%), so this section covers only those.
Small businesses are the largest client group, at 42%. Of the 384 with a known size, 162 involve small businesses (1 to 50 employees), 75 medium businesses (51 to 200), 54 large businesses (201 to 1,000) and 93 enterprises (more than 1,000).
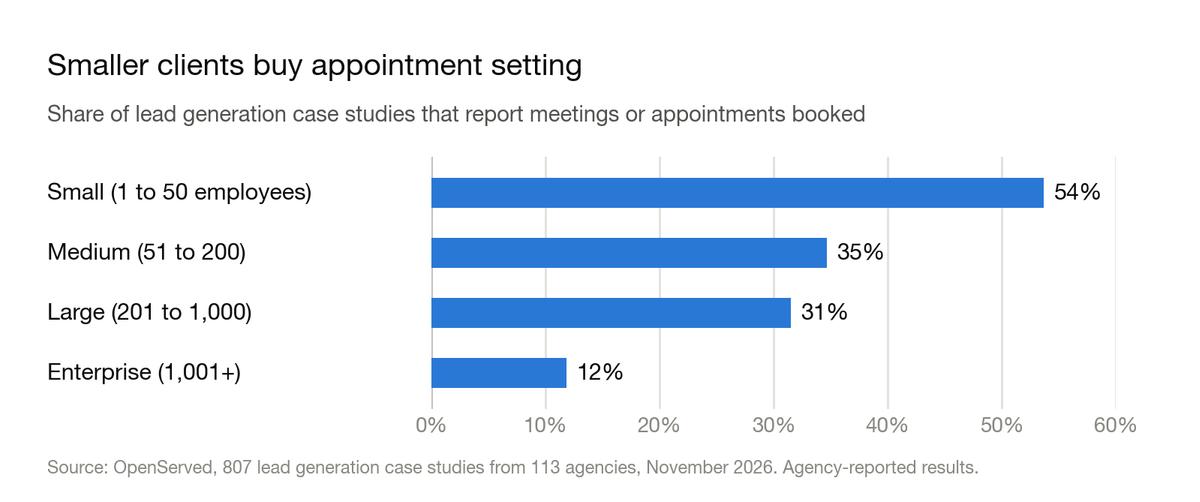
The smaller the client, the more likely the program is appointment setting. Meetings or appointments are reported in 54% of small-business case studies, 35% of medium, 31% of large and 12% of enterprise ones.
Small businesses book a median of 11 meetings a month. 39 case studies state it, with the middle half between 8 and 15. No other size has 20 data points for any metric.
Lead generation statistics by country
Country is the client's location, not the agency's. It is recorded for 511 of the 807 case studies (63%), so this section covers only those.
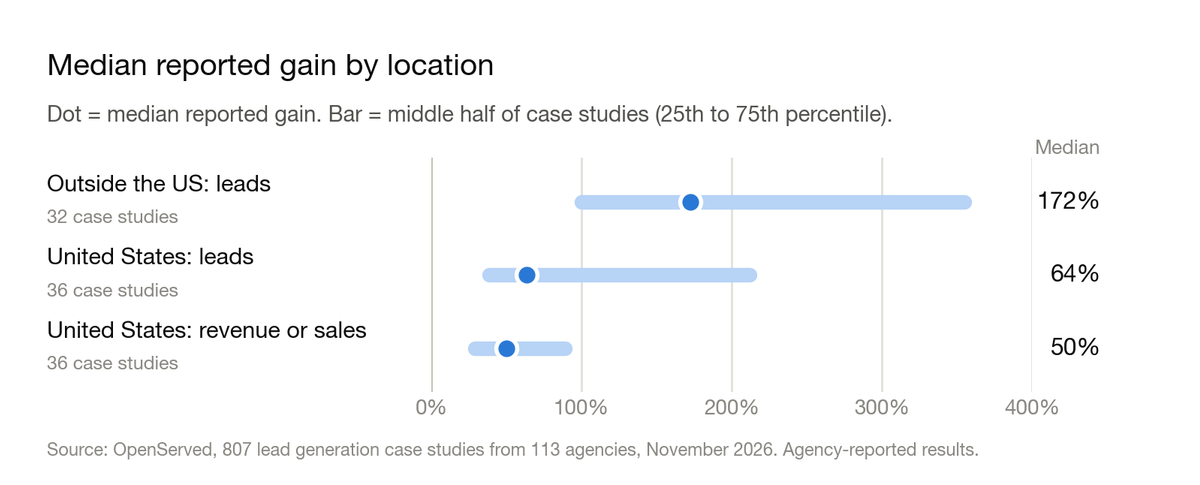
Lead generation is the most international service in the directory. 65% of located case studies are for US clients, against 70% to 86% for every other service. 330 of the 511 are in the United States, and the other 181 are spread across 41 countries and territories, led by the United Kingdom (56) and Canada (36).
US clients report a median 64% increase in leads. 36 US case studies state one, with the middle half between 38% and 212%. They report a median 50% increase in revenue (36 case studies), a median of 11 meetings a month (53) and 22 leads a month (28).
Clients outside the US report a median 172% increase in leads. 32 case studies state one, with the middle half between 100% and 355%. They also report a median 50% cut in cost per lead (20 case studies).
How long lead generation takes: what the data can tell you
None of the 807 case studies records how long the engagement ran. But many state the period behind a result: 33% include a time reference, most often "year over year", "3 months" or "6 months".
That is what makes monthly rates possible. 177 counts of leads or meetings come with a period, such as "34 appointments booked in 2 months". If an agency quotes you a number of leads or meetings, ask over how long, and how many months the program needed before it started producing them.
The agencies behind the data
Three agencies publish 22% of the lead generation case studies. Belkins has 69, SalesAR 57 and Outbound System 51, all outbound lead generation agencies. Half the agencies have three or fewer.
A few agencies dominate each metric. Belkins supplies 49 of the 93 meetings-per-month figures, SalesAR 24 of the 47 reply rates, memoryBlue 12 of the 40 pipeline values and Acceleration Partners 23 of the 68 revenue figures. Where removing the largest publisher changes a median, this page says so.
How much of this data is verified?
15% of lead generation case studies are Client-verified. 117 of the 807, from 45 agencies, carry OpenServed's Client-verified badge, meaning the named client confirmed the results. The other 85% are agency-reported.
Verified meeting numbers match agency-reported ones. Verified case studies report a median of 10 meetings a month (20 case studies), against 11 for agency-reported ones (73). Other metrics have too few verified data points to compare.
Keep this in mind with every number on this page. A published case study is an agency's best work, described in the agency's words. Without a client confirming it, it's a claim, not a benchmark.
What this means if you're hiring a lead generation agency
- Decide which kind of lead generation you need. Marketing-led agencies bring in leads through ads, search and content. Sales-led agencies book meetings through outreach. Their case studies measure different things.
- Ask for a rate, not a total. "300 leads" means little until you know whether it took one month or a year. The median program that states it produces 28 leads or 11 meetings a month.
- Ask what a lead or a meeting means. Agencies count form fills, qualified leads, booked calls and held meetings, and rarely say which.
- Ask what happened after the meeting. Only 14% of case studies report deals closed or new clients, and pipeline is not revenue.
- If you run paid lead generation, ask for cost per lead before and after. The median reported cut is 42%.
- Ask whether the client confirmed it. 15% of lead generation case studies are Client-verified.
You can browse every case study behind these numbers in OpenServed's lead generation agency directory, and filter by industry, client size and location.
Methodology
- Source: all 807 case studies in OpenServed's directory that list Lead Generation as a service, as of November 3, 2026, from 113 agencies. Each links to the agency's own published case study.
- Result stats: each case study carries the result stats the agency published, as free text. We assigned each stat to a metric by keyword matching: leads, meetings or appointments, pipeline, deals and new clients, revenue, cost per lead or acquisition, reply rate and traffic.
- Percentage changes: medians of gains and cuts use stats that state a percentage change. Cuts in cost per lead of 100% or more are left out.
- Monthly rates: where a stat gives a number of leads or meetings and the period it took, such as "80 appointments booked in 7 months" or "12+ qualified leads per month", we converted it to a monthly rate. Ranges such as "19-20 meetings per month" use the midpoint. Counts without a period are left out of the rates.
- Pipeline: the first dollar value in a stat that mentions pipeline. Agencies define pipeline differently.
- Reply rates: stated levels for reply or response rates, not changes.
- Marketing-led and sales-led: marketing-led case studies also list PPC, SEO, Local SEO, Social Media Ads, Content Marketing or Web Design. The rest are counted as sales-led.
- One data point per case study: if a case study has several stats for the same metric, we use the first one listed.
- Median and middle half: we report the median, not the average, because a handful of very large results would distort an average. The middle half is the range from the 25th to the 75th percentile.
- Minimum sample: we report a segment only when it has at least 20 data points for that metric.
- Missing details: client size is recorded for 48% of these case studies and location for 63%, so those sections cover only the case studies that have them.
- Industry groups: we merged 105 industry labels into 13 groups for the roll-up figures. Client size uses employee count: small is 1 to 50, medium 51 to 200, large 201 to 1,000 and enterprise more than 1,000.
- Selection bias: agencies publish their wins, and the directory is not a random sample of the industry. Three agencies account for 22% of these case studies.
- Agency-reported: except for the 117 Client-verified case studies, results are as published by each agency and haven't been independently confirmed.
Cite this data: OpenServed, "Lead Generation Statistics 2026: Results From 800+ Agency Case Studies", November 2026, https://openserved.com/blog/lead-generation-statistics
FAQs
How many lead generation case studies did you analyze?
807 case studies from 113 agencies, as of November 2026. Each one lists Lead Generation as a service and links to the agency's own published case study.
How many meetings should an appointment-setting agency book per month?
The median case study that states it reports 11 meetings or appointments a month, and half fall between 8 and 17. These are published wins, so a typical program is likely to land lower.
How many leads per month does a lead generation agency deliver?
The median is 28 leads a month across case studies that state a period, but the spread is wide: a quarter report fewer than 10 a month and nearly a quarter report 100 or more. Marketing-led programs report more leads than sales-led ones.
How much can lead generation lower cost per lead?
Where a case study reports it, the median cut in cost per lead or acquisition is 42%, and half fall between 28% and 62%. Most of these case studies also list PPC.
What is a good cold outreach reply rate?
The median reply or response rate stated in these case studies is 17%, and half fall between 7% and 36%. One agency supplies half of these figures; without it the median is 36%.
What's the difference between marketing-led and sales-led lead generation?
Marketing-led programs use ads, SEO and content and report leads and cost per lead. Sales-led programs contact prospects directly and report meetings booked and pipeline. 40% of sales-led case studies report meetings, against 1% of marketing-led ones.
How long does lead generation take to work?
No case study records how long the engagement ran, but a third state the period behind a result, most often 3 or 6 months or year over year.
Are these results verified?
15% of lead generation case studies carry the Client-verified badge. Where the two can be compared, verified meeting numbers are about the same as agency-reported ones.