
We Analyzed 2,098 Marketing Case Studies. Here's What We Found
5 min readLast updated October 9, 2026
On this page
OpenServed's directory now holds 2,098 case studies from 69 agencies, spanning 163 industries and 46 distinct services. We pulled the whole dataset apart, not just what agencies say happened, but how they say it, what they leave out, and who keeps showing up, to see what the numbers actually reveal.
Data as of September 2026. As more case studies are added, these figures will change, this post is a snapshot, not a running total.
This is the flagship post in a series. Several findings below point to a deeper dive we'll publish separately.
Key findings
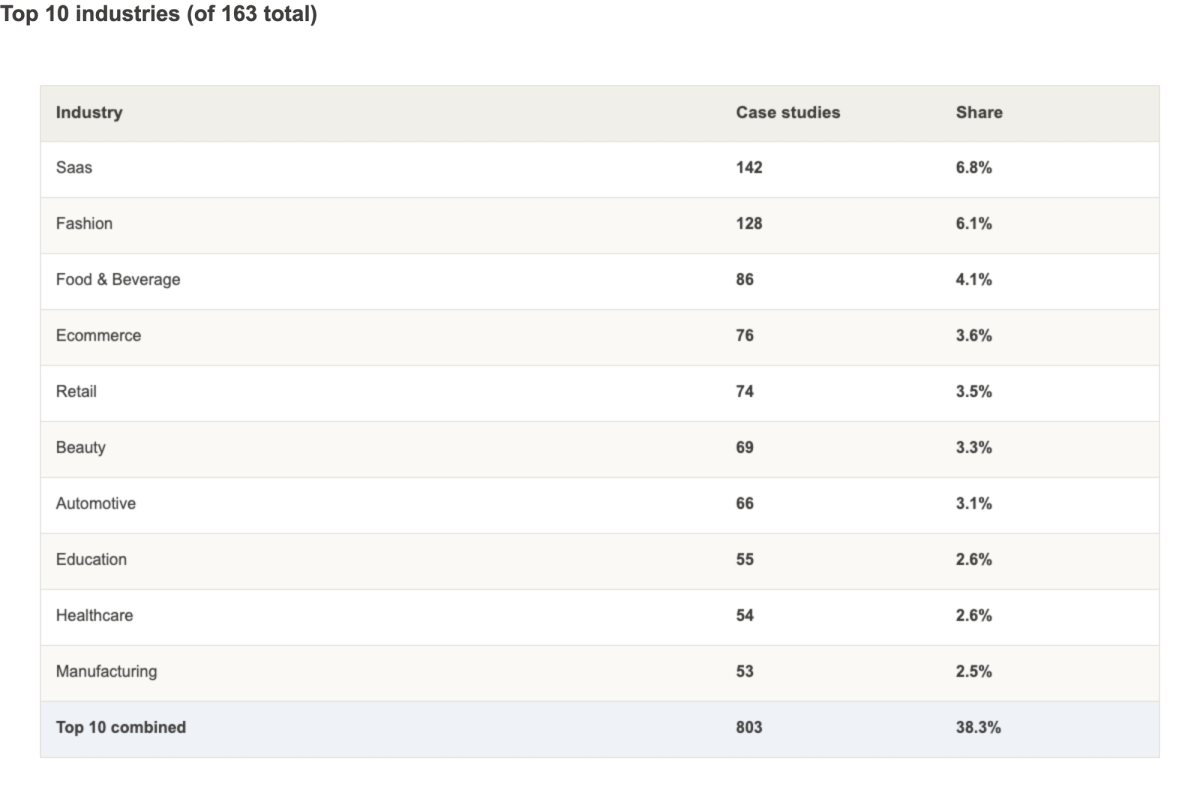
1. No industry comes close to dominating: the top 10 industries combined make up only 38.3% of all case studies, and 32 of the 163 industries have exactly one. SaaS leads with 142 case studies, Fashion follows at 128. But the long tail is enormous: half the industries in the taxonomy have fewer than 10 case studies each. Agencies are marketing to nearly every kind of business, not clustering around a few lucrative verticals.
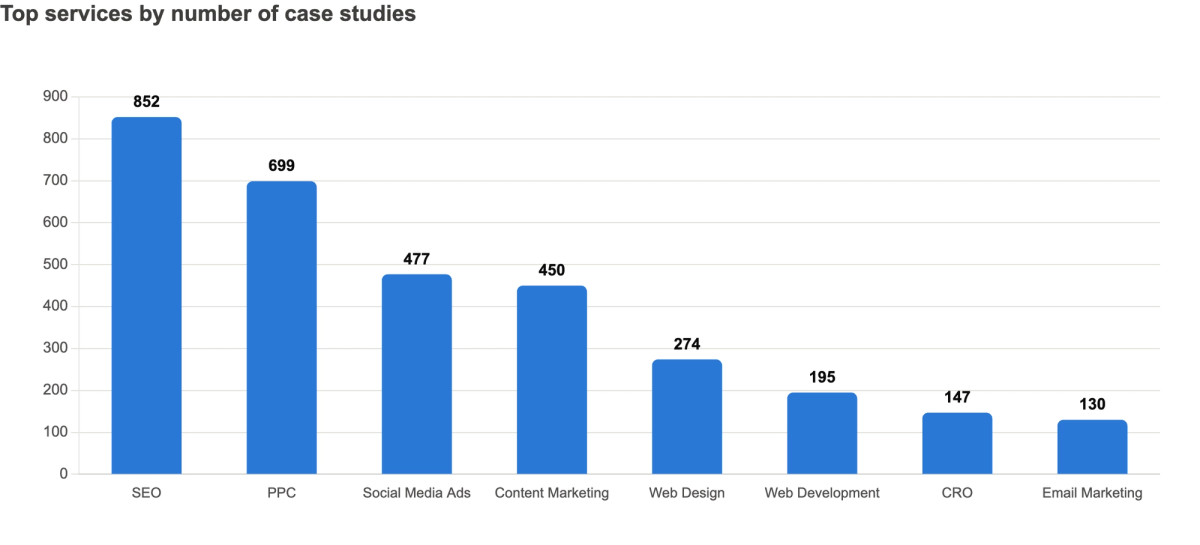
2. SEO is the single most common service, appearing in 852 case studies, 41% of the entire dataset. PPC is second at 699, then Social Media Ads (477) and Content Marketing (450). SEO alone appears in more case studies than PPC and Content Marketing combined.
3. Most case studies bundle services rather than sell one thing: only 695 of 2,098 (33%) list a single service. 699 list exactly two, and 556 list three. The most common pairing by far is PPC + SEO, appearing together 310 times, followed by Content Marketing + SEO (190) and PPC + Social Media Ads (176).
4. When an agency does feature just one service, it's almost always SEO or PPC. Of the 695 single-service case studies, 219 are SEO alone and 162 are PPC alone, together well over half. Social Media Ads is a distant third at 123. Everything else, from email marketing to CRO, barely registers as a standalone story.
5. Percentages dominate the stat vocabulary, but they're not the only currency: 68% of all 6,711 result stats are percentages. Beyond the 4,592 percentage stats, 401 cite a dollar figure, 167 use an "Nx" multiplier format (like "7x ROI"), and 1,567 are plain counts with no unit at all (like "1,200 appearances in AI Overviews").
6. When agencies name a specific efficiency metric, they say "ROAS" nearly four times more often than "ROI." "ROAS" appears in 160 result stats; "ROI" appears in 42. For an industry that talks about both interchangeably, the case-study record has a clear preferred vocabulary, and it's the ad-spend-specific one.
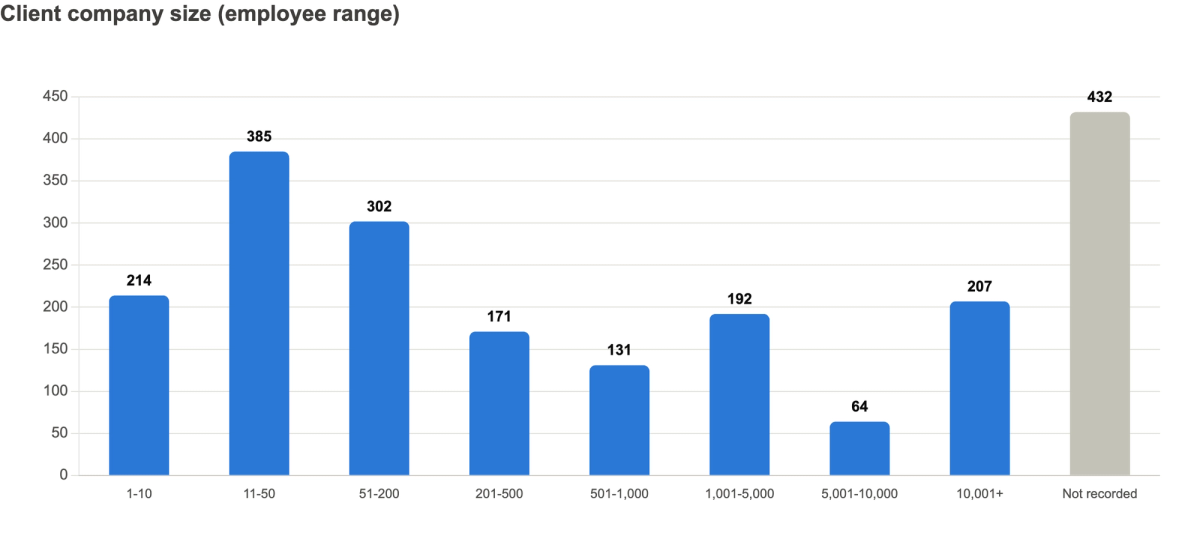
7. Small businesses are the most common client size, but employee-range data is missing for over a fifth of all case studies. Companies with 1-10 or 11-50 employees account for 599 case studies combined, more than any other size bracket. But 432 case studies (21%) have no employee-range recorded, mostly older imports where the field was never filled in.
8. California alone accounts for roughly 1 in 5 case studies with a known location. 421 case studies trace back to a California-based client, more than New York (157) and Texas (138) combined.
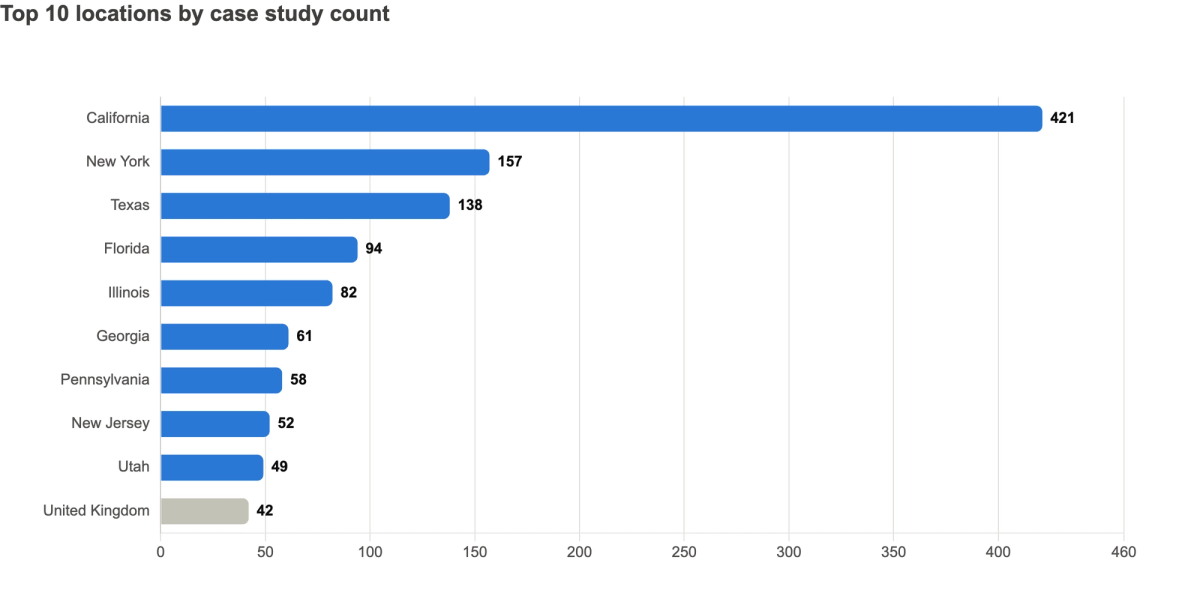
9. 259 case studies, 1 in 8, are based outside the United States. The United Kingdom leads international representation with 42 case studies, followed by Australia (22), Germany (18), and Switzerland (16). Marketing case studies in this directory reach at least a dozen countries beyond the U.S.
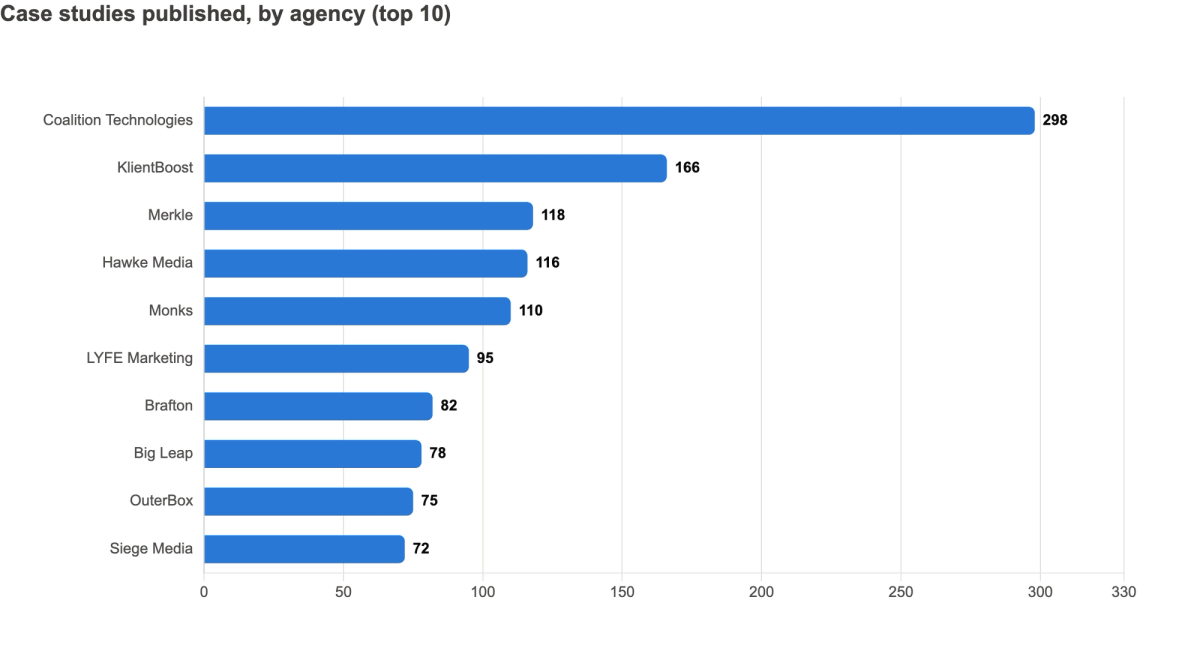
10. Three agencies account for over a quarter of all case studies in the directory, but the long tail of agencies is real too. Coalition Technologies (298), KlientBoost (166), and Merkle (118) together contribute 582 of the 2,098 case studies, 28%. At the other end, 10 of the 45 agencies with any case studies have published 10 or fewer, and only 5 agencies have published more than 100.
11. Some clients show up again and again, regardless of which agency is telling the story: Google is the most-cited client name in the directory, appearing in 12 separate case studies from different agencies. Nike and Netflix each appear 6 times, Sephora and KFC 5 times each. 90 distinct client names appear more than once across the dataset.
12. Case studies almost never explain the "why": only 51 of 2,098 (2.4%) include a problem/solution narrative, and only 37 (1.8%) include an actual client quote. Those fields are concentrated almost entirely among the 50 Client-verified case studies, meaning the vast majority of entries are result stats and a client name, with no explanation of the challenge or the approach.
13. Only 50 of 2,098 case studies, 2.4%, carry OpenServed's Client-verified badge. The other 97.6% are agency-reported claims that have not been confirmed by the named client.
14. Engagement length is almost never stated, and when it is, 3 months is the answer nearly a third of the time. Only 29 of 2,098 case studies (1.4%) specify how long the engagement ran. Of those, "3 months" appears 9 times, more than any other duration, followed by "6 months," "4 months," "1 year," and "1 month," each appearing 3 times.
15. Reported percentage gains vary wildly: the median is 77%, but 232 stats claim over 1,000% growth, and the largest single claim is 158,558%. Half of all percentage claims fall at or below a 77% improvement, a plausible, ordinary number. Outliers like the 158,558% figure are almost certainly measured against a near-zero starting point. We'll dig into that specific claim, and the pattern behind it, in its own post.
The takeaway
At nearly 2,100 case studies, this is a large enough sample to spot real patterns: SEO's dominance, the multi-service norm, California's concentration, the small handful of agencies driving volume, and the near-total absence of independent verification or narrative depth behind the numbers. The posts that follow will each take one of these threads and go deeper.